Linked Responses
Statement 1: "Well paid, highly motivated employees are vital to goal achievement," Statement 4: "Poorly paid or motivated employees defeat goal achievement in spite of careful planning and management," and Statement 20: "Careful planning and effective management can attain goals in spite of personnel pay and motivation," are linked in that that they each express a view of the importance of employee pay and motivation in relation to goal achievement. Statement 1 was a simple, straightforward, non-threatening expression of the value of motivated employees. The researcher anticipated that both groups would hold similar views, and both groups had similar mean distributions of 4.30 for the public and 4.38 for the private sector with a distribution mode of 4.00 for each.
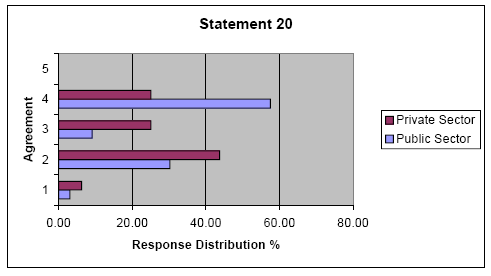
Figure 2
Statement 4 and Statement 20 represent reciprocal viewpoints and introduce conflict between the factors of employee pay and motivation versus careful planning and effective management. Mean response for Statement 4 was 4.0 for both groups and the t-test analysis produced a probability of .466335 and the null hypothesis could not be rejected. However, the null hypothesis for Statement 20 was rejected when the t-test produced a probability of .0411541. The mean distribution was 3.21 for the public sector and 2.69 for the private sector. The mode distribution was 4.00 (agree) for the public sector and 2.0 (disagree) for the private sector. A review of the graphic presentation (Figure 2.) of all responses to Statement 20 visually provided an impression that there exists some disagreement between the sectors with a higher percentage of neutral responses from the private sector raising the possibility of a higher degree of uncertainty on this matter within that sector.
Statement 2: "Mission Statement is a guideline that can be altered to meet short-term economic or political situations," is linked to Statement 6: "Mission Statement is a formal statement of purpose that is inflexible in spite of short-term economic or political change." These statements are reciprocal views of the mission statement. Statement 2 referred to the "weak" concept of a mission statement. Statement 6 referred to the "strong" concept of a mission statement. The t-test for Statement 2 returned a probability of .216025, while the probability for Statement 6 was .104024. Applying the rejection threshold of .05 the null hypothesis for both statements was not rejected. However, a calculation of distribution mean and mode for each statement revealed that for Statement 2 the public sector had a mean of 2.61 and a mode of 2.00, while the private sector mean was 2.94 and its mode was 4.00. The public sector had a mean of 2.48 and a mode of 2.00 for Statement 6, while the private sector had a mean of 2.94 and a mode 4.00. Statistically, the null hypothesis was sustained; however the mean results indicated that each survey group had disagreed with both statements, while the modes reflected a divergence of view similar to results attained for Statement 20. These inconsistencies generated an investigation of all responses to the statements as presented in Figures 3 and 4.
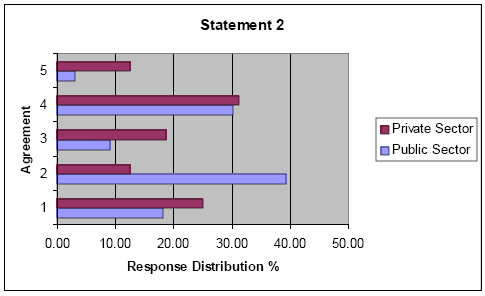
Figure 3.
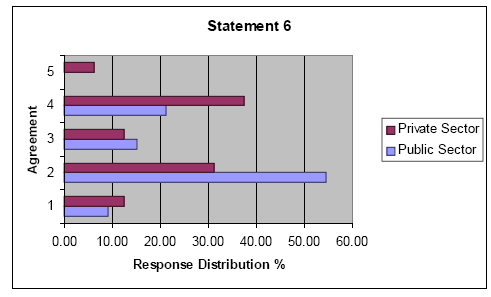
Figure 4
A review of these response distributions gave credence to the belief that the distribution mode was a more accurate predictor of the correlation of opinion between the two groups. However, the fact that the mean distribution of each survey group rejected both statements implied a degree of misunderstanding, or at least a lack of familiarity, with the concept of a mission statement. This issue provides an interesting question that would certainly justify additional research, but, as these findings were not considered germane to the research project in progress, the researcher accepted the t-test results that the null hypotheses for Statement 2 and 6 could not be rejected, and therefore, both survey groups would have a similar, if somewhat scattered, distribution.
Statement 3: "Perceived quality is usually more important than the cost of a product or service when setting goals," is a reciprocal statement linked to Statement 8: "Cost is usually more important than quality of a product or service when setting goals." These statements reflect the natural competition between cost and quality of goods and services. The null hypothesis for Statement 3 was sustained by a t-test probability of .338870. The public sector mean was 3.06 and mode was 4.00, while the private sector mean was 3.19 and mode was 4.00. There was also strong agreement in the distribution of responses for Statement 8 that produced a t-test probability of .422003, a public sector mean of 2.36 and mode of 2.00, while the private sector had a near identical mean of 2.31 and mode of 2.00. The null hypothesis for Statement 8 could not be rejected. The distribution of opinion had similar distribution in both survey groups with the general tendency in agreement with the importance of quality over cost in establishing goals as reflected in the identical sector modes of 4.00 for Statement 3 and 2.00 for Statement 8.
Statement 7: "Private sector management is generally more innovative and cost-effective than their public sector peers," is linked to Statement10: "Public sector management is generally more innovative and cost-effective than their private sector peers." These reciprocal statements go directly to the issue of performance quality as viewed within the sectors. There was an anticipated variance in the distribution between the two groups, but that variance came with an unexpected twist. The null hypothesis was rejected for Statement 7, with a t-test probability calculated at .00000. The public sector tended to reject the statement, as expected, with a mean of 2.52 and a mode of 2.00, while the private sector strongly agreed with the statement with a mean of 4.63 and a mode of 5.00.
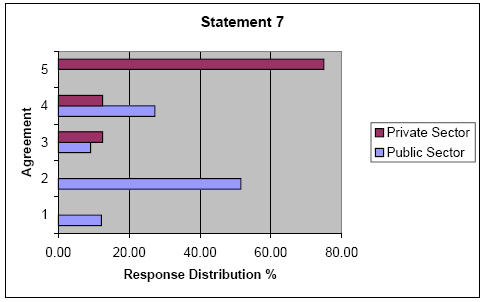
Figure 5.
A review of the response distribution confirms that the private sector strongly supported Statement 7 (Figure 5.), while the public sector at least moderately disagreed with that statement. The surprising twist was found within the results for Statement 10. Again the null hypothesis was rejected by a t-test probability of .00000. In this case however, the public sector had a mean of 2.88 and a mode of 3.00, while the private sector had a mean of 1.50 and a mode of 1.00. A review of all responses to Statement 10 (Figure 6.) confirms the unexpected finding that the public sector and the private sector distributions are dissimilar; however the variance is in the degree of negativity rather than polar opposition. Both groups have some responses that indicate disagreement, and the disagreement is more strongly expressed within the private sector, yet 28% of the public sector respondents also disagreed with the statement.
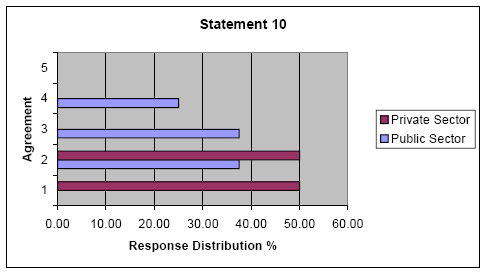
Figure 6.
Statement 12: "Government employees are generally less motivated than private sector employees." is linked to Statement 16: "Private sector employees are generally less motivated than government employees." Employee motivation is the link between these reciprocal statements. A significant divergence in the response distribution resulted in the rejection of the null hypothesis for both statements with t-test probability for Statement 12 at .0000001 and for Statement 16 at .000153. The public sector had a distribution mean of 2.22 for Statements 12 and 2.50 for Statement 16, with modes of 2.00 for both statements. The private sector had a mean distribution of 3.56 for Statement 12 and 1.75 for Statement 16, with a mode of 4.00 for Statement 12 and 2.00 for Statement 16.
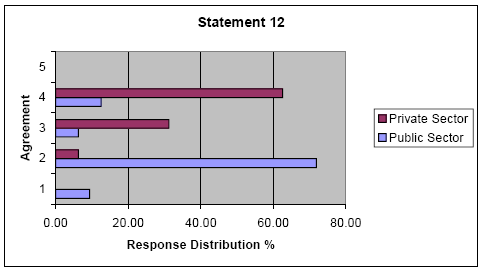
Figure 7.
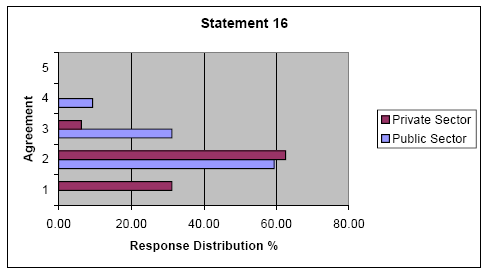
Figure 8.
A visual inspection of the response graphs in Figures 7. and 8. supports the rejection of the null hypothesis for both statements. In responding to Statement 12 the public sector group provides modest support for its employees as compared to the strong support shown by its private sector peers, but this support disappears when the issue is readdressed in Statement 16. In this case the public sector tends to disagree that private sector employees are less motivated, albeit with less intensity than the private sector survey group.
Statement 11: "The soft cost of tax-exempt financing tends to negate the interest savings on all but the largest public debt offerings," is linked with Statement 15: "Tax-exempt financing provides the public sector with a significant financial advantage over the private sector in similar transactions." These statements address reciprocal thoughts pertaining to the idea that the public sector's tax-exempt financing provides an artificial imbalance in the financial markets. There was a measure of uniformity in the responses of both sectors that reflected general disagreement with Statement 11, and the t-test probability of .373566 failed to reject the null hypothesis. The public sector had a mean distribution of 2.72 and a mode of 2.00, with the private sector attaining a similar mean of 2.81 and an identical mode of 2.00. These negative opinions of Statement 11 were reversed for Statement 15 as both groups had very similar distributions. The t-test probability of .346092 could not reject the null hypothesis, and the public sector mean of 3.44 was similar to the private sector mean of 3.31. Both groups had a mode of 4.00.
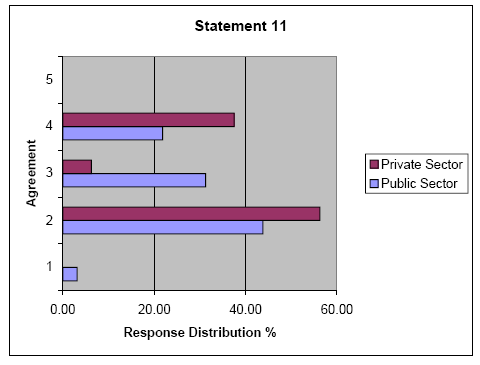
Figure 9.
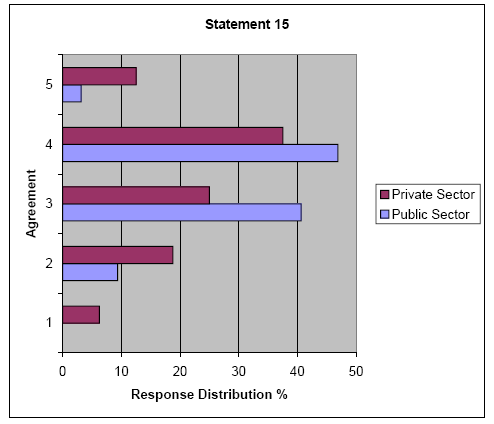
Figure 10.
Inspection of the response distribution graphs (Figures 9. and 10.) reveals that profiles for Statement 15 were quite similar, while the graphs for Statement 11 reflect a degree of uncertainty in the public sector not reflected in the private sector; however the group responses were statistically similar.