Non-linked Responses
Statement 13: "The continual turnover of elected officials generally makes effective long-range planning difficult within the public sector." This statement addressed the political environment that affects both survey groups, and both groups tended to agree on this statement with the private sector holding perhaps the substantially stronger view of the two. Regardless, the t-test probability of .0129586 could not reject the null hypothesis, and the public sector had a mean distribution of 3.53, while the private sector had a mean of 3.88. Both groups had identical modes of 4.00.
Statement 5: "Public sector management must work within a framework of bureaucratic regulation that tends to minimize innovative goal setting." This statement introduced the concept of the inefficient bureaucrat. Again the two groups diverged in their opinions and the null hypothesis was rejected with a t-test probability of .0000067. The public sector generally disagreed with a mean response of 2.70 and a mode of 2.00. The private sector strongly supported the idea with a mean response of 4.31 and a mode of 5.00.
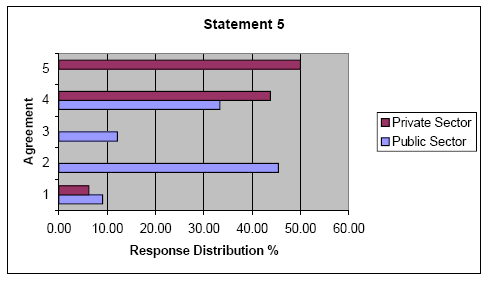
Figure 11.
Inspection of the response distribution graph paints a clearer picture of the sizeable variance in the response distribution between the two groups.
Statement 9: "The private sector's primary goal is the maximization of short-term profits." This statement introduced the profit motive, but its emphasis was on the private sector's pursuit of short-term profit. Again the null hypothesis was rejected by a t-test probability of .0010224. The public sector had a mean response of 3.66 and a mode of 4.00, while the public sector achieved a mean distribution of 2.56 and a mode of 2.00. An inspection of the response distribution (Figure 12.) gives visual credence to the statistical finding that the survey groups strongly disagree with one another on this issue.
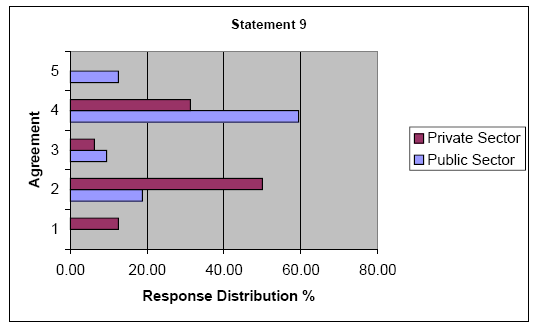
Figure 12.
Statement 14: "Public bidding and disclosure regulations generally prevent public sector managers from maximizing the cost-benefit potential of purchased goods and services." The impact of bidding and disclosure requirements on the efficiency of the public sector business model was addressed in Statement 14. Both groups were internally split with near equal numbers agreeing or disagreeing with the statement. The null hypothesis was sustained by a t-test probability of .204335. The public sector had a mean distribution 2.97 and a mode of 2.00, while the private sector had a mean distribution of 3.25 and a mode of 2.00. The identical negative mode of 2.00 might lead one to believe that the groups tended to disagree with the statement, but a close inspection of the response distribution graph (Figure 13.) shows that "indecision" would be a better term as both groups are almost equally distributed around neutrality.
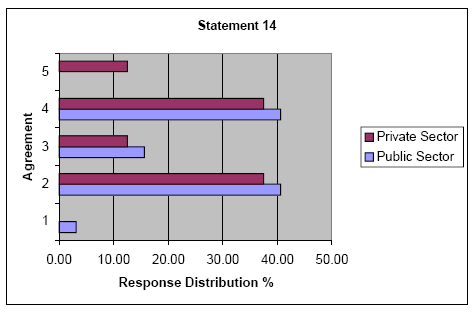
Figure 13.
Statement 17: "The pressure to satisfy stockholders generally forces private sector managers to emphasize short-term profit goals over quality attainment," attempts to tie the need to pay dividends to a reduction in the quality of goods and services. Here again the weakness of a Likert scale comes to the forefront, as the null hypothesis could not be rejected at the desired level of sensitivity due to a calculated t-test probability of .077717. However, the public sector had a mean distribution of 3.52 with a mode of 4.00, and the private sector had a mean of 3.00 and a mode of 2.00.
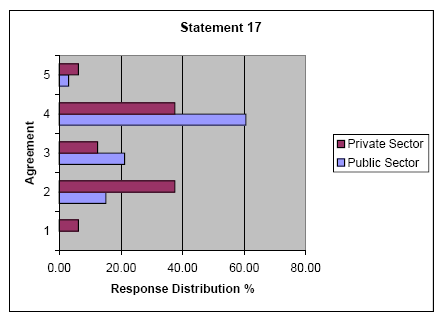
Figure 14.
Visual inspection of the response distribution graph shows significant dissimilarities in the distribution curves for each group, and points to the need for additional research on this issue. The researcher chose to make note of these conflicts, but to proceed with the larger research project by accepting that the null hypothesis was not rejected by the data presented.
Statement 18: "Private sector managers are generally well compensated for goal achievement while public sector managers receive no additional compensation for similar results." The difference in compensation and incentives for private sector managers compared to their peer managers in the public sector is well documented. This statement was included to test the responses of both groups, and a generally positive response was expected from both sectors. Results were as anticipated as significant agreement with this statement was present across the groups. The t-test analysis produced a probability of .50000 and the null hypothesis could not be rejected. The public sector had a mean distribution of 3.91, and the private sector had a mean of 3.88, with both sectors having identical modes of 4.00.
Statement 19: "Successful goal setting generally implies making a "least risk" decision, regardless of options that might produce enhanced results." Unlike Statement 18, above, this statement offered an opportunity for the groups to provide insight into their adversity toward risk. Both groups showed a willingness to accept risk and produced responses heavily reflecting a resistance to passing up opportunities for enhanced results in order to seek low risk. The null hypothesis was rejected by a t-test probability of .380478. The public sector had a mean distribution of 2.24, and the private sector had a mean of 2.13. Both groups had identical modes of 2.00.
Statement 21: "The aggressive "for profit" attitude within the private sector often creates problems for public sector clients." Responses for this statement reflect similar distributions within each group and a basic agreement with the concept presented. The t-test analysis resulted in a probability of .179893 and the null hypothesis could not be rejected. Additionally, support was given to the statistical probability by a mean distribution of 3.33 for the public sector and 3.56 for the private sector, with identical modes of 4.00 for both survey groups.