5.6.1. Market context
After the end of the Cold War, volumes of international arms transfers declined significantly - in 2002, it was only 38% of the 1982 peak, according to the Stockholm International Peace Research Institute (SIPRI)29. Since 2002, volumes have recovered somewhat, though the arms trade remains significantly smaller in scale than was previously the case and declined in 2008, relative to 2007 (Figure 5-4).
SIPRI data on actual deliveries of major conventional weapons indicate that approximately 80 per cent of the volume of exports between 2003 and 2007 was accounted for by the five largest suppliers-the US, Russia, Germany, France and the UK, as shown in Table 5-2.
Volume of arms exports (1982-2008)*
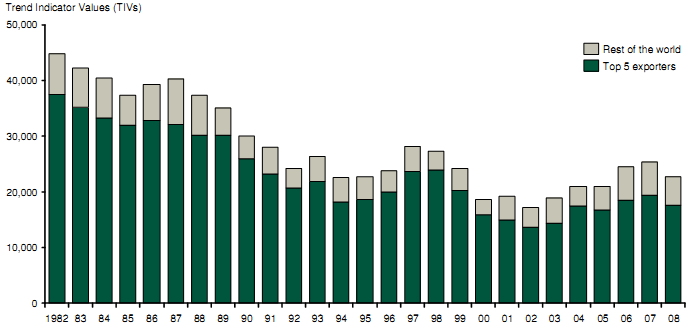
Note: Top 5 exporters includes US, Russia, Germany, France and UK; * Figures are SIPRI Trend Indicator Values (TIVs) expressed in US$ m. at constant (1990) prices
Source: SIPRI Arms Transfer Database
Figure 5-4: Volume of arms exports 1982-2008
Supplier | Share of total global arms exports (%) | Total number of recipients | Major recipients (share of supplier's transfers) | ||
1st | 2nd | 3rd | |||
US | 31 | 69 | S. Korea (15)% | Israel (13%) | UAE (11%) |
Russia | 25 | 46 | China (42%) | India (21%) | Algeria (8%) |
Germany | 10 | 47 | Turkey (15%) | Greece (13%) | S. Africa (12%) |
France | 8 | 39 | UAE (32%) | Singapore (13%) | Greece (12%) |
UK | 4 | 37 | US (21%) | India (14%) | Chile (9%) |
Note: The dominance of these five nations is long established: the same participants accounted for 84% (by volume) of all exports over the period 1980-1984. As remains the case, the US and the USSR (now Russia) both play a significantly larger part in the transfer of military hardware than smaller European nations
Source: SIPRI
Table 5-2: Top 5 global suppliers of major conventional weapons and their largest recipients (2004-08)
are monetary (US$ m. at constant (1990) prices), TIVs do not represent the financial value of goods transferred; rather, they provide an indication of the volume of arms transferred between two trading partners.
Although Germany is a significant provider of arms in terms of volume, many German exports consist of military aid and the sale of second-hand equipment. As a result, export performance in value terms presents a rather different situation, as illustrated in Figure 5-5.
Value of military exports by nation of origin
(2007)
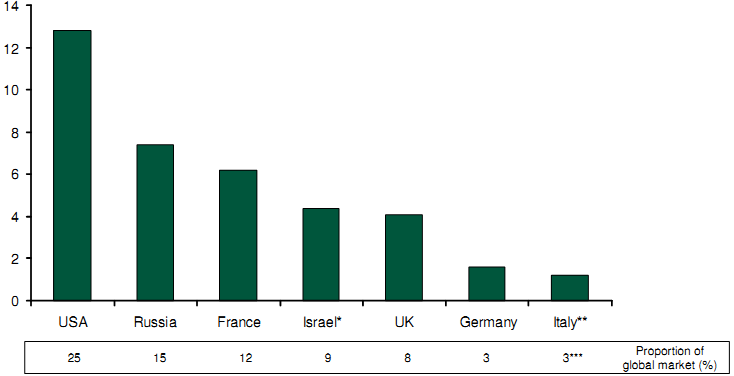
Note : *A significant proportion of Israel's arms exports is comprised of electronics and other components which are not included in the volume data;
** Latest data from 2006; *** Based on total global export value for 2006
Source: SIPRI
Figure 5-5: Value of military exports by nation of origin
Due to differences in the way in which national statistics are defined and complied, it is difficult to make precise cross-boarder comparisons of the value of the arms trade. A number of different sources compile estimates on different bases, and these are mostly not comparable due to a number of factors. For instance, there is no internationally agreed definition of what constitutes 'arms'. There are also differences between the ways in which various governments collect and report data: some states report the value of licences issued; others the value of licences used; yet others publish data collected from customs agencies. A number of states produce more than one data set based on different lists of goods or different methodologies.
For the purposes of consistency, this report presents figures for the financial value of the international arms trade from SIPRI, who compile publicly available information into consolidated analyses. On their analysis, the international arms trade in 2007 was worth $51.1 billion30.
The largest arms exporter in 2007 was the US, with exports worth $12.8 billion. The UK was in fifth position31, although relative to the UK's domestic spend on the procurement of military equipment, however, export performance appears rather better, as shown in Figure 5-6.
Export value as percentage of procurement spend 2006 | Export value as percentage of GDP 2006 |
|
|
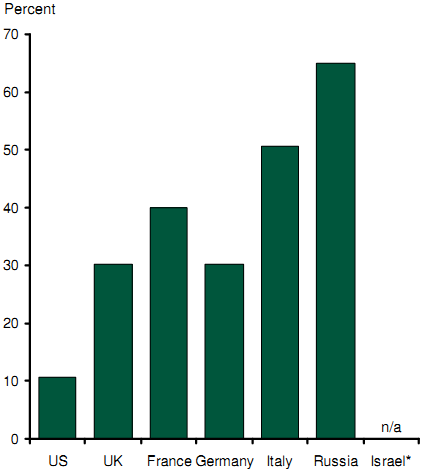
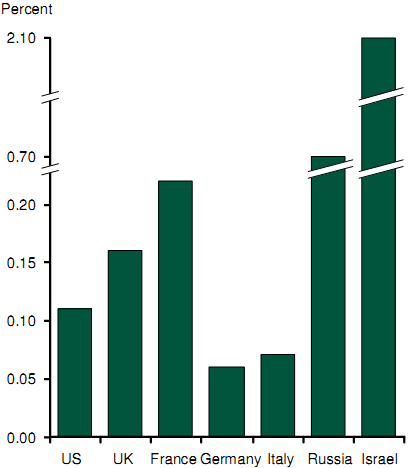
Note: * Israeli army procurement spend not disclosed
Source: SIPRI; NATO; IMF; Globalsecurity.org; Review team analysis
Figure 5-6: Military exports relative to size of exporter
Military exports account for more than 0.15% of GDP in both the UK and France, which is higher than many other nations, with the notable exceptions of Russia and Israel. Relative to domestic spend on military procurement, the UK is roughly in line with other major military powers in Europe (which typically lie between 30% and 50%), but significantly ahead of the US. France outperforms the UK, exporting goods worth c.40% of its own procurement budget; if the UK were to develop its export market to the same degree, an additional £600-£900m in sales would be generated every year.
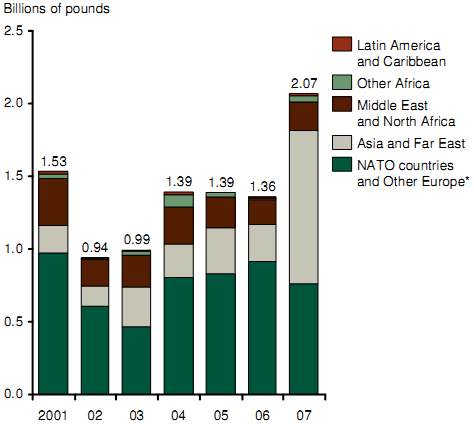
Value of UK Military export deliveries by type | Value of UK Military export deliveries by destination |
|
|
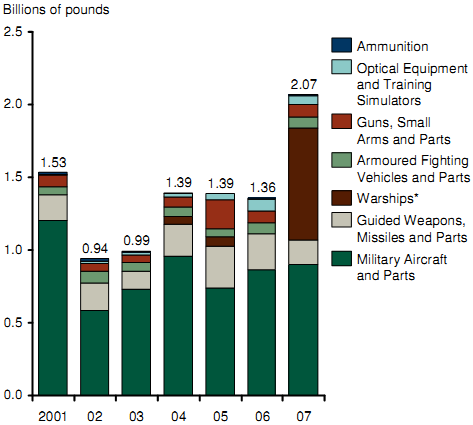
Note: *The large increase in the value of identified exports in the Warships category in 2007 is due to the overseas delivery of three Offshore Patrol Vessels
Source: DASA
Figure 5-7: UK military exports by type and destination
The bulk of the value of UK military exports can be accounted for by sales to foreign governments of military aircraft and parts (see Figure 5-7), predominantly long-term deals to supply Hawk-60 aircraft to the U.S. and Hawk-100 aircraft to India. UK sales in other categories of equipment typically accounted for only 25-40% of exports, around half of which is sales of guided weapons and missiles. UK export sales since 2007 have remained reasonably strong, including:
• sales of 66 Hawk trainers and 20 Jaguar combat aircraft to India (of which delivery started in 2007);
• further sales of Typhoon fast jets to Saudi Arabia32; and
• agreements to provide the governments of Oman and Trinidad and Tobago with warships.
__________________________________________________________________________________________________________________________________
29 SIPRI data on arms transfers are presented in the form of Trend Indicator Values ("TIVs"). This metric seeks to measure the military implications of arms transfers by evaluating the technical parameters of weapons transferred between nations. Weapons are assigned an indexed value according to their performance. These values reflect the military resource value of the weapon in relation to other weapons relative to some pre-determined benchmark. Although the units of TIVs
30 Reports from the Congressional Research Service, which use different source data from SIPRI and different market definitions, estimate the market to be worth $31bn. In fact, a number of significant arms exporters (including China) do not release data on the financial value of their arms exports, so the actual value of the global market for arms is likely to be higher than the $51.1bn reported by SIPRI.
31 Reported Israeli sales of $4.4bn relate to 'contracts signed' and not the value of goods exported.
32 Saudi Arabia does not feature as a major recipient of UK exports in Table 5-2 because these data do not include spares and components. Also, delivery of Typhoon aircraft is still pending and so not included here.