6.4.2. Development of the EPP between Departmental planning rounds
The future planned total EPP spend has been analysed for the last four planning rounds42 and is shown in Table 6-1.
Near-cash spend (£bn nominal) | 2009/10 - 2019/20 | 2020/21 - 2029/30 | 2030/31+ | Total 2009/10+ |
EP05 | 78.8 | 50.2 | 12.9* | 141.9* |
EP07 | 82.8 | 58.9 | 38.4 | 180.1 |
PR08 | 91.0 | 72.3 | 48.9 | 212.2 |
PR09** | 89.3 | 82.0 | 64.0 | 235.3 |
Note: Note: * EP05 did not explicitly track spend beyond 2034/35; ** PR09 data is after options and manual adjustments (as at 23rd of April) but has not been confirmed as the "final" EPP for PR09.
Source: CapEP, Review Team Analysis
Table 6-1: Development of EPP cost projection over recent Planning Rounds
In each of the last four years, the total projected equipment plan costs covering the same 25 year period (i.e., 2009/10 to 2034/35) have increased significantly. To understand what has driven these increases, the individual P9 lines incorporated within PB&F have been examined. Figure 6-2 shows that the increased programme totals between PR0743 and PR09 have arisen from both inclusion of new P9 lines and increases in the costs of existing P9 lines. This latter increase is generally attributable to project delays or unexpected cost variances.
Drivers of cost increase in EPP
CDEL+DRDEL (Billions of Pounds 'Near Cash', nominal)
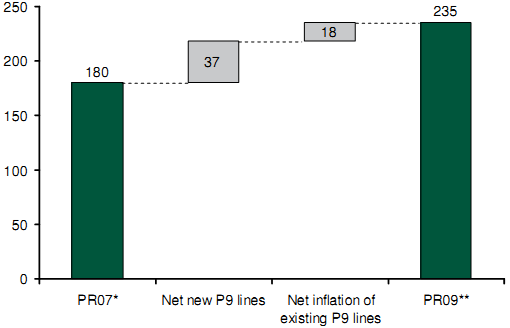
Note: Includes the cost of the future deterrent, which is subject to separate funding arrangements with the Treasury on the basis (announced in the 2006 White Paper) that the cost of the deterrent will not be at the expense of the conventional capabilities required by the Armed Forces.
* Detail to allow diagnostic is not available for EP05;
** PR09 is after options and manual adjustments (as at 28th of May), but is not the final EPP
Source: CapEP; Review team analysis
Figure 6-2: Drivers of cost increase in the EPP (£bn nominal)
Across the two year period from PR07 to PR09, the average annual rate of addition to the EPP (to its stage 3b iteration) from new P9 lines44 is £19bn, and a further £9bn p.a. is added from net increases to the cost of projects already in the EPP.
The creation of a "new" P9 line does not always correspond to funding that has been added into the equipment plan, as individual projects do not necessarily map exactly onto P9 lines consistently over time. Existing P9 lines are frequently merged together or split apart, making detailed analysis of evolving spending plans and commitments very difficult.
Because of the way in which funding lines are managed, it is therefore possible for apparently 'new' funding to have previously been recognised in the plan under a different a different P9 code. This issue is particularly problematic with equipment in the complex weapons area, where additional phases of existing / legacy projects are introduced as new P9 lines, despite the fact that some of the associated spend was accounted for within existing projects45. There is no simple way to audit the way in which project funding is transferred between P9 lines on a year to year basis.
Table 6-2 identifies a number of P9 lines that are known to correspond to major new projects which have been added to the EPP since PR07.
New P9 line added | Description |
Successor Platform (P900455000) | Next generation of nuclear deterrent submarine |
Application and infrastructure development (P900493000) | Future Business Group funding for ISS (of which 99% beyond 10 years) |
New generation nuclear propulsion plant (P900459000) | Successor platform nuclear propulsion plant |
Command and control (P900456000) | Successor platform command and control system |
Core production capability (New core factory) (P900458000) | Regeneration of the Submarine Nuclear Core Manufacturing Capability |
Note: Values shown are after options and manual adjustments (as at 28th May), but are not necessarily the final EPP
Source: CapEP, Review team analysis
Table 6-2: Key projects added since PR07
Similar problems are encountered with the analysis of cost growth on existing P9 lines. It is not possible to identify what has driven cost growth on existing P9 lines; in some instances, growth is directly related to cost overruns on the associated projects; in others, cost growth is driven by the inclusion of funding for replacement equipment or other future capability enhancements that were not previously included. The Review team has identified a subset of the P9 lines that have significantly increased their net costs from 2009/10 onwards between PR07 and stage 3b of PR09 (without regard for the cause of the increase). These include:
• Maritime underwater future capability (P900020100)
• Support vehicles46 (SV) (P900130300)
• "Specialist" (P900041200) - CISR equipment for special forces
• Future surface combatant (P900005700)
• MASC (P900050500)
• Future aircraft carrier (CVF) (P900007200)
• Future rapid effect system (FRES) (P900025900)
Recent EPP annual expenditures have been running at levels just under £6bn per annum. Clearly, adding over £25bn to the plan per year on any sustained basis will extend the time required to complete work significantly, assuming an expenditure cap of the order of £6bn p.a. going forward.
__________________________________________________________________________________________________________________________________
42 No planning round took place in 2006.
43 Insufficient detail is available on EP05 to allow diagnostic analysis of causes of increase between EP05 and PR09
44 Net of deleted P9 lines.
45 Specifically, a number of Complex Weapons projects (including the 100kg Family and the 50kg Family Surface Attack, the CAMM Family of air defence missiles, the Hellfire Replacement and the Watchkeeper Training & Technology Insert) have been introduced to the EPP as distinct P9 lines since EP07. Some funding for each of these projects was previously included on other P9 lines, but it is not possible to ascertain by how much.
46 Cost growth has been primarily driven by SV replacement