6.7.3. Development of the ESP over time
The first ESP that programmed a full ten years of spend was issued at the end of PR08. As indicated in Table 6-5, the total near-cash spend over the nine years covered in both plans increased by £2.8bn between the end of PR08 and stage 3b of PR09. This c.4% increase is less than the cost growth in the EPP.
| PR08 (Final version) | PR09 (Stage 3b -not final ESP) |
Total near-cash spend 2009/10-17/18 (£bn) | 63.8 | 66.1 |
Note: PR09 ESP data is after options and manual adjustments to 28th May, but is not the final ESP
Source: CapEP, Review team analysis
Table 6-5: Planned spend in ESPs issued in successive planning rounds
Although efficiency gains (for example those derived from moving up the 'transformation staircase' described in Chapter 7) may lead to cost reductions in some areas, these benefits are smaller than increases that arise elsewhere. The underlying causes of the increased cost of delivering the ESP have not been explored by the Review team, although some of the likely contributory factors are discussed in the next section.
The way in which the planned spend has to be 'squeezed' through planning rounds is illustrated in Figure 6-5. The data presented there suggest that the amount of resource that is required may, in fact, actually be substantially greater than that which is available: at the end of Stage 1 in PR09, the total required spend on equipment support was almost £70bn.
Development of the PR09 ESP
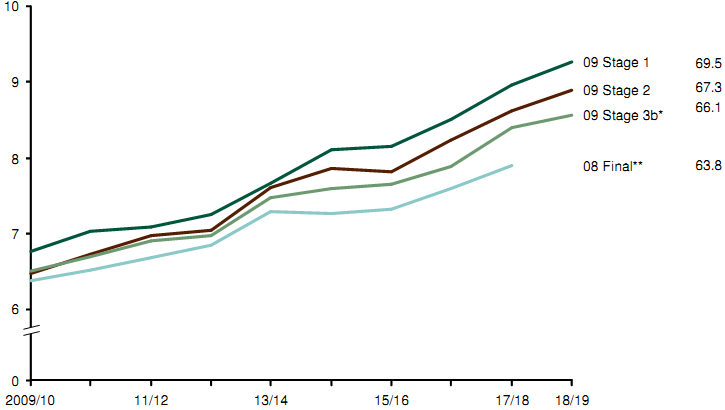
Note: *After options and manual adjustments (as at 28th May 2009), but not final ESP as stage 3c, which includes application of a "block adjustment" as in PR08, yet to complete
** PR08 final subject to unallocated "block adjustment" which forced the ESP to meet Control Total
Source: CapEP
Figure 6-5: Equipment Support Plan spend by stage of planning round.
This costing, generated using a bottom-up analysis of what would be required to deliver the plan, represents a 9% increase on the final PR08 numbers. Successive iterations of the plan have found between £3bn-£4bn of savings over the full ten years of the plan. Further work may also identify additional savings that can be made as part of PR09 but which have not been available to this Review due to the timing of the release of the "final" PR09 figures. There have been some measures undertaken already to allow the short-term affordability of the ESP to be addressed.
Although some of the savings that have been included in the budget may be related to efficiencies that are being driven through the system, it is likely that some are also due to the decision to defer some non-essential maintenance tasks. Any such savings are likely to have an adverse impact on capability; in the most extreme case, they could lead to the withdrawal of certain assets from service. Deferral of routine maintenance is also likely to lead to a reduction in availability because reliability would be expected to decline if maintenance operations are conducted less frequently (or completely) than specified. The effect of deferring / cutting routine maintenance can be seen with fleet availability in Figure 6-6.
Surface fleet readiness as % of RFED requirement
(2000-09)
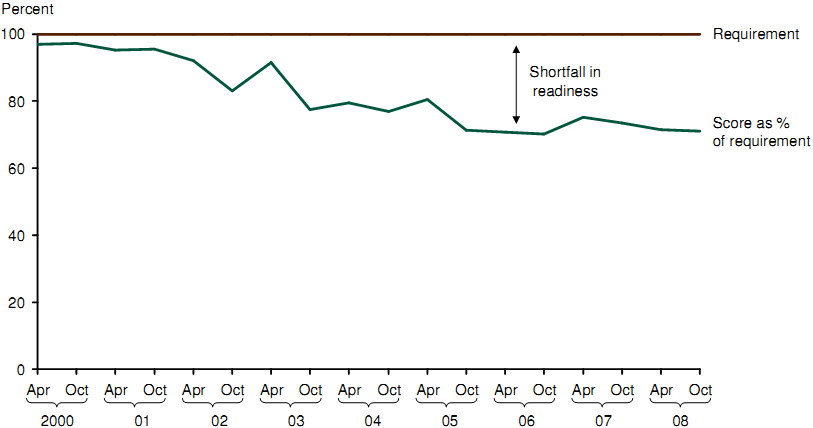
Figure 6-6: Fleet availability
Furthermore, the cost reductions recorded in the ESP are likely to give rise to cost increases elsewhere in the system: although deferring support spend to later years may provide a headline cost saving, the cost of reintroducing mothballed equipment into service or conducting emergency repairs and remedial works are likely to be significant.
Beyond these direct factors, the cost risk associated with deferral (for example, the cost of losing industrial capacity), and the opportunity costs of missing capability mean that the true total cost of support deferral are likely to be significant.