7.3.3. Planning for risk
Analysis has also been undertaken of the 10%, 50% and 90% estimates for duration and cost of Demonstration and Manufacture phase. The findings of this analysis are set out in Figure 7-2.
Forecast duration estimates (time to "in-service) | Forecast cost to completion estimate^ |
Index of project duration (Forecast at Initial Gate50 = 100) | Index of unit cost^ (Forecast at Initial Gate50 = 100) |
|
|
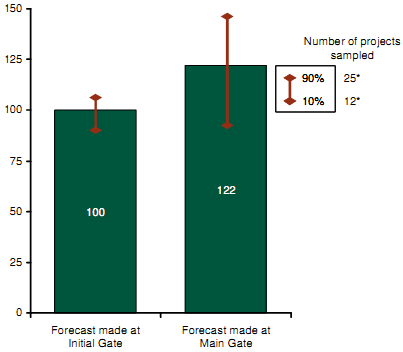
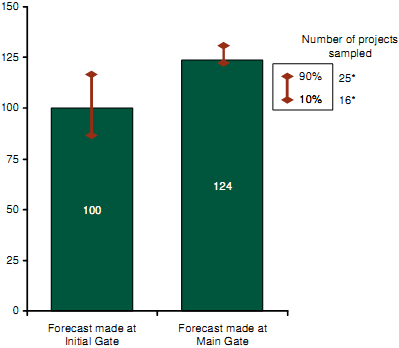
Note: * Sample of projects where two / three point (10%, 50%, 90%) forecast data exists at both Initial Gate and Main Gate;
^ Total forecast cost to completion (incl. cost of capital) ÷ number of "units" at forecast
Source: CMIS (Feb 2009); IAB; Review team analysis
Figure 7-2: Forecast 10%, 50% and 90% duration and cost estimates for Demonstration and Manufacture phase
As can be seen from Figure 7-2, the 10% - 90% range of estimates for duration of Demonstration and Manufacture phase increases on average during the Assessment phase. However, the equivalent average range for cost narrows.
Whilst the behaviour of the range for cost reflects the intended purpose of the Assessment phase (i.e., risk reduction, better definition of Performance / Cost / Time envelope) the findings for duration are counter-intuitive.
One hypothesis which may explain the development of the duration envelope between Initial Gate and Main Gate is that the range of duration estimates given at Initial Gate may better reflect the aspirational "delivery window" for the military capability, whereas the Main Gate estimates are more cognisant of the remaining technical uncertainties surrounding development and access to funding.
It should be noted that many projects currently under development that submitted business cases for IAB approval failed to include ranged envelopes for duration and / or cost, or omitted at least the 10% estimate.