7.4.2. Diagnosing the causes of changes to Main Gate estimates
Causes of changes to ISD and cost estimates are captured through DE&S' CMIS database.72 The Review team has analysed this data over the last five years. Figure 7-3 shows the aggregate delay across all projects for each year. The "size" of the portfolio in terms of duration is shown below in the box (e.g., in 2005 total slippage was around 295 months on 4,274 months or 6.9%).
Total duration to ISD50 variation for all projects past Main Gate* (2005-09)
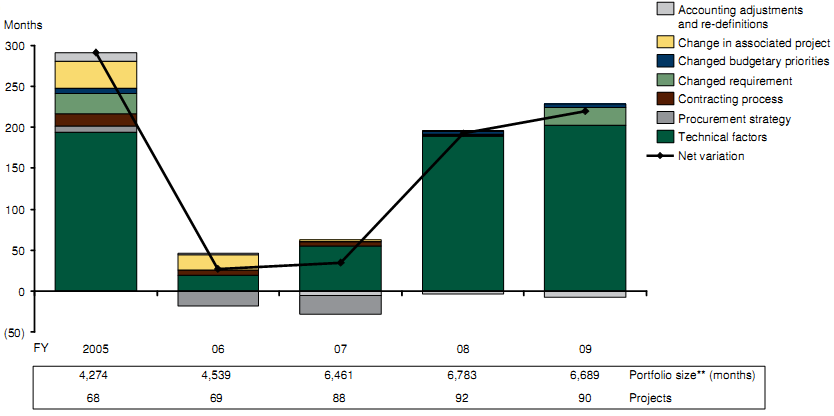
Note: * Cat A to C only; ** Latest forecast project duration (excludes Lynx HUMS and SEA King HUMS and ATEI)
Source: CMIS (31 Mar 2009); Review team analysis
Figure 7-3: Causes of variation to ISD50
It is notable from Figure 7-3 that the vast majority of delay amongst projects past Main Gate is attributable to "technical factors" (86% over the last five years). However, the reasons given for changes in forecast cost to completion in Figure 7-4 are somewhat more varied (only 11% of cost increase due to "technical factors" over the same five year period).
Total cost 50 variation for all projects past Main Gate*
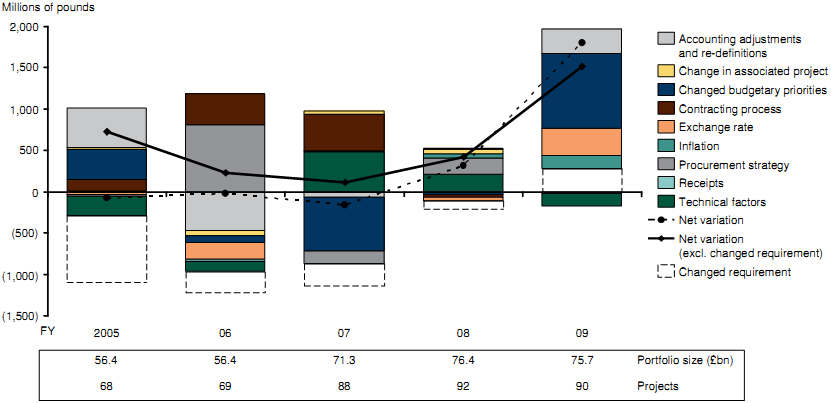
Note: * Cat A to C only, excludes Lynx HUMS and SEA King HUMS
Source: CMIS (31 Mar 2009); Review team analysis
Figure 7-4: Causes of variation to cost to completion50
For changes to either cost or time estimates, it is worth noting the apparent disconnect between the qualitative feedback the Review team has received and the self declared quantitative information captured in DE&S' CMIS system. A key concern is the cost increase and time slip resulting from "changed requirements" from the Department, which qualitatively was regarded as a major cause of change, did not show up as significant driver from the actual recorded data.
__________________________________________________________________________________________________________________________________
72 These data are broadly consistent with, but not identical to, that presented by the NAO in its Major Project Reports, at an aggregate level