7.4.3. Planning for risk
An analysis of the development of the 10%, 50% and 90% envelope for time and cost between Main Gate and ISD has been conducted (see Appendix F for detailed methodology). Figure 7-5 shows the results of this analysis for duration.
Average inflation of forecast duration between MG and ISD*
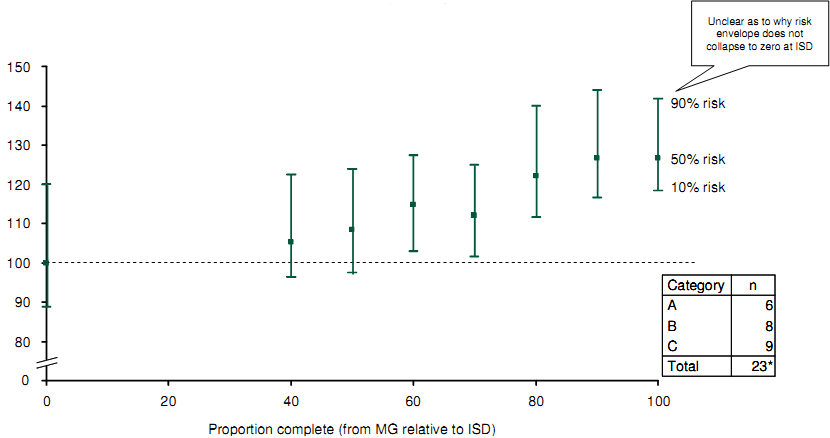
* Only for those 23 projects that whose latest ISD forecast is before the date of latest forecast (2/2/2009) and the first forecast was made within 40% of the time between MG and ISD
Source: CMIS (Feb 2009); Review team analysis
Figure 7-5: Development of 10%, 50%, 90% duration envelope post Main Gate approval
Figure 7-5 shows that whilst the 50% estimate for the duration of the Demonstration and Manufacture phase increases primarily during the latter stages of the average project, the range of uncertainty surrounding the timing of delivery of capability does not significantly reduce over the same period. The Team's view is that this reflects the relatively low importance placed on risk estimation and monitoring.