7.5.1. Initial Gate to Main Gate plus Main Gate to ISD
By combining the analyses undertaken on projects which have completed their Assessment phases with analyses undertaken on projects which are largely "mature" in their Demonstration and Manufacture phases, it is possible to build a picture of the overall performance of the acquisition system.
Between Initial Gate and ISD the expected duration of Initial Gate to ISD for the average project increases by 81% (see Figure 7-6) and the average total cost of the Assessment, Demonstration and Manufacture phases increases by 42% (see Figure 7-7).
Average growth in project duration (time to "in service") for 'mature' projects**
Index of project duration (Forecast at Initial Gate50 = 100)
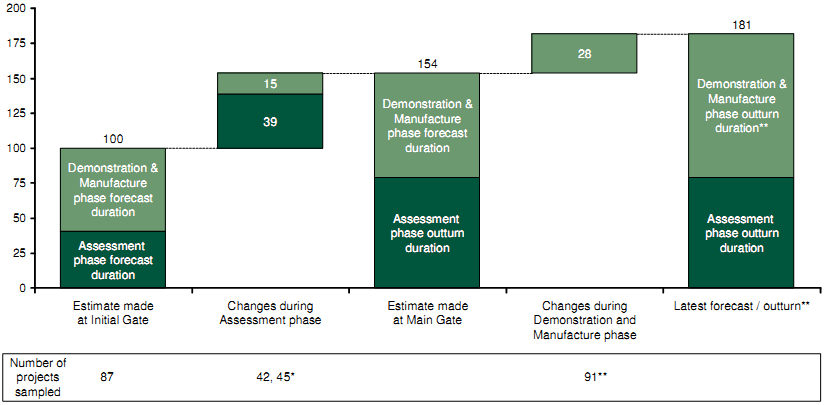
Note: * Sample of 42 for Initial to Main Gate forecast and 45 projects for Main Gate to In Service Date; ** Projects over 75% complete and in-service
Source: CMIS (Feb 2009); NAO Major project reports; IAB; Review team analysis
Figure 7-6: Average growth in project duration
Average growth in project cost for 'mature' projects**
Index of adjusted unit cost^ (Forecast at Initial Gate50 = 100)
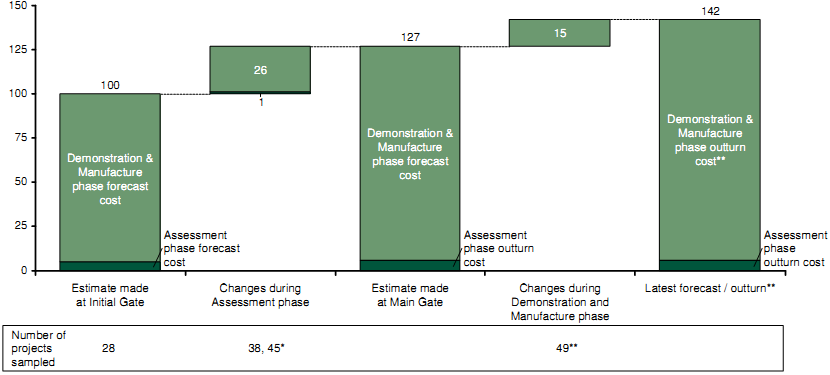
Note: * Sample of 38 in the Assessment Phase and 45 in the Demonstration & Manufacture Phase; ** Projects more than 75% complete at latest forecast
Source: CMIS (Feb 2009); NAO Major project reports; IAB; Review team analysis
Figure 7-7: Average growth in project cost
Project performance from Initial Gate to ISD has also been analysed along the following dimensions:
• project maturity. Projects are distinguished according to the time elapsed since MG, expressed as a proportion of latest forecast MG to ISD duration;
• project size. Projects are split into three categories: Category A (those where the total cost to completion is greater than £400m), Category B (total cost between £100m and £400m) and Category C (total cost in the range £20m-£100m);
• contract type. The nature of the commercial contract let for the manufacture of the equipment; and
• Smart / Non-Smart73.
In order to maximise the size of the samples on which segmental analyses are performed, average project performance from IG to MG is assumed across all projects. Segmental variations are only considered in performance after projects have been through Main Gate.
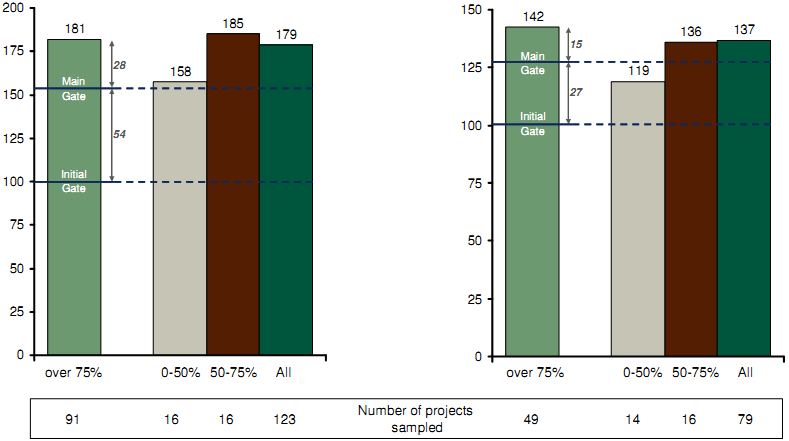
Figure 7-8 shows how project performance varies with maturity.
| Latest forecast project duration overrun by Maturity | Latest forecast cost overrun by Maturity |
| Index of project duration (Forecast at Main Gate50 = 154) | Index of adjusted unit cost (Forecast at Main Gate50 = 127) |
|
| |
Note: Straight average shown
Source: CMIS (Feb 2009); NAO Major project reports; IAB; Review team analysis
Figure 7-8: Project performance by maturity
Segmenting projects by post Main Gate maturity highlights the apparent better performance of "young" projects. This can be put down to two factors:
1) insufficient time has elapsed for delays and cost overruns to have yet materialised in the younger projects; and
2) even if overruns have occurred, project teams are more likely to declare delays and cost overruns as the project approaches ISD.
Because of these issues, results presented elsewhere in this report, specifically the 'average' duration and cost overrun analyses shown in Figure 7-6 and Figure 7-7, relate only to the performance of "mature" projects (i.e., those that are more than 75% complete - see Appendix F.7).
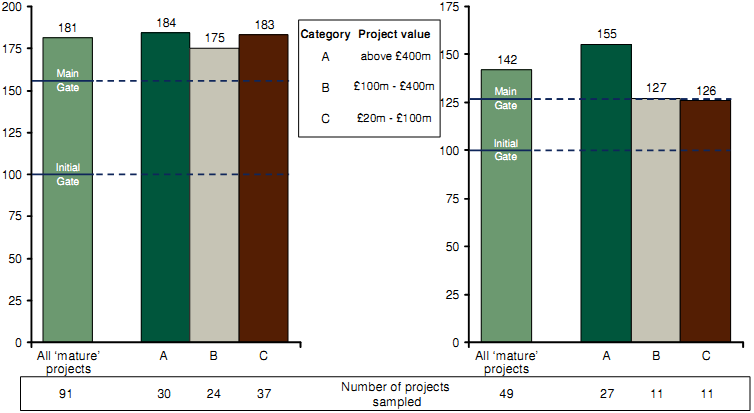
The impact of project size (as determined by total expected cost to completion at Initial Gate) on performance is shown in Figure 7-9 below.
| Latest forecast project duration overrun by contract type* | Latest forecast project cost overrun by contract type* |
| Index of project duration (Forecast at Main Gate50 = 154) | Index of adjusted unit cost (Forecast at Main Gate50 = 127) |
|
| |
Note: Straight average shown; Projects more than 75% complete at latest forecast;
* Analysis of difference by segment is based on growth during D&M phase only
Source: CMIS (Feb 2009); NAO Major project reports; IAB; Review team analysis
Figure 7-9: Project performance by Category
Analysis of cost growth by project category indicates that larger Category A projects on average suffer greater cost overruns than smaller Category B and C projects post-Main Gate. Duration overruns appear to be broadly similar across Category A-C projects.
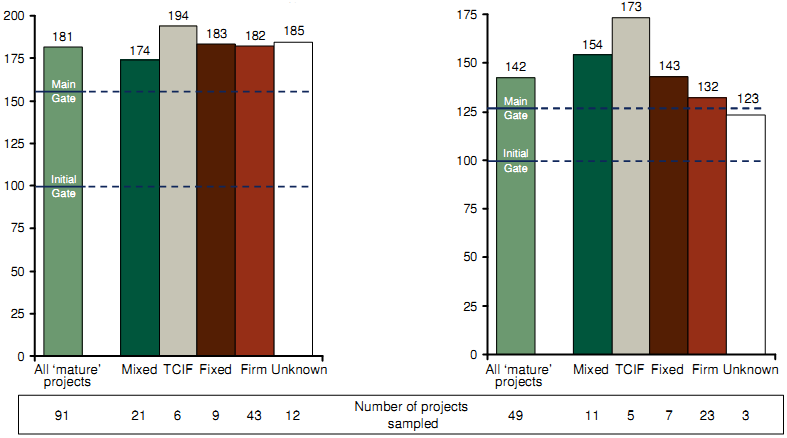
Figure 7-10 presents the analysis of duration and cost overruns by contract type.
Latest forecast project duration Latest forecast project cost
overrun by contract type* overrun by contract type*
| Latest forecast project duration overrun by Maturity | Latest forecast cost overrun by Maturity |
| Index of project duration (Forecast at Main Gate50 = 154) | Index of adjusted unit cost (Forecast at Main Gate50 = 127) |
|
| |
Note: Straight average shown; Projects more than 75% complete at latest forecast;
* Analysis of difference by segment is based on growth during D&M phase only
Source: CMIS (Feb 2009); NAO Major project reports; IAB; Review team analysis
Figure 7-10: Project performance by contract type
Performance in terms of duration overrun appears to be broadly similar across all contract types, with Target Cost Incentive Fee ("TCIF") projects suffering the greatest overruns. Projects with TCIF contracts also perform the worst in terms of cost overrun, with Firm contracts showing the least average overrun. It is important to note, however, both Firm and Fixed project costs are likely to include a greater contingency for risk in their original estimates and so may not represent the best value for money even if the overrun relative to MG estimates is generally less significant.
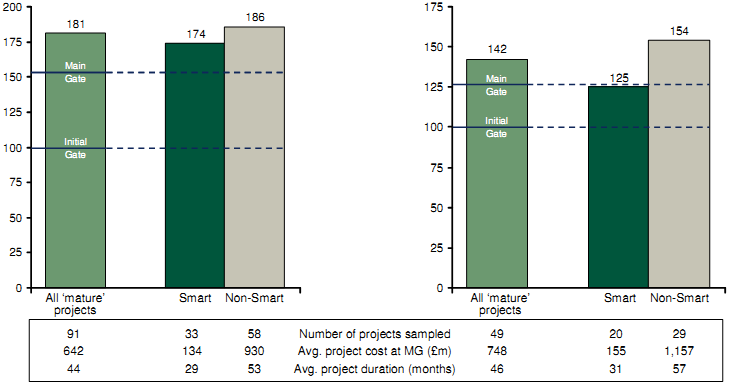
Figure 7-11 compares the average performance of mature projects which were run following the principles of Smart Procurement with those which were not.
| Latest forecast project duration overrun by Smart / Non-Smart* | Latest forecast cost overrun by Smart / Non-Smart* |
| Index of project duration (Forecast at Main Gate50 = 154) | Index of adjusted unit cost (Forecast at Main Gate50 = 127) |
|
| |
Note: Straight average shown; Projects more than 75% complete at latest forecast;
* Analysis of difference by segment is based on growth during D&M
phase only. Non-Smart projects include projects post 1999 deemed to have followed non-Smart principles, e.g. follow on buys of Non-Smart projects Source: CMIS (Feb 2009); NAO Major project reports; IAB; Review team analysis
Figure 7-11: Performance of Smart and Non-Smart projects
On average, mature Smart projects outperform non-Smart projects in terms of both cost and duration overrun between IG and ISD.
__________________________________________________________________________________________________________________________________
73 Non-Smart projects include projects post 1999 deemed to have followed non-Smart principles, e.g., follow-on buys of non-Smart projects.