7.7.1. Conceptual framework for the full cost of delay
The Review team is concerned that current Departmental project management and accounting practices fail to capture the true cost of delay both at a Departmental and a system level. To attempt to better understand the cost of delay, the team explored a range of potential impacts, from obvious cost increases measured directly as cost-to-complete escalation, to a range of hidden or unattributed cost increases both inside and outside the EP. Using available information (which is often limited), the analysis attempted to allocate a range of costs around delay impacts, expressed on a per annum basis.
The factors considered are shown in Table 7-9 below, with further detail provided in Appendix G.
| Sources and analytical estimation techniques used |
Unproductive project costs77 | Regression analysis of CMIS data |
Hidden industry costs | Review of accounts of major suppliers to MoD Interviews with IPT Leaders |
Potential capability gap costs | |
Run-on equipment costs | Review of run-on costs identified in NAO Major Project Reports Generalisation from limited sample to whole EPP based on two different methodologies |
MoD internal costs | Analysis of DE&S costs captured in Administrative Cost Regime (mainly payroll costs) Estimated additional management time dedicated to planning round |
Table 7-9: Summary of analyses undertaken to understand cost of delay
Whilst best endeavours have been applied in deriving estimates for the total cost of delay at a Departmental level, it should be noted that there is substantial uncertainty surrounding the estimation of these costs at this level arising from the need to generalise from relatively few examples in each case. The summary of estimates presented in Table 7-10 are, therefore, highly indicative.
£m p.a. | Low estimate | High estimate |
Unproductive project costs | 500 | 1,200 |
Hidden industry costs | 100 | 350 |
Potential capability gap costs | 110 | 250 |
Run-on equipment costs | 100 | 130 |
MoD internal costs | 110 | 220 |
Estimated annual cost of delay | 920 | 2,150 |
Source: Review team estimates
Table 7-10: Estimates of cost of delay (indicative)
The results appear startling, particularly given that the annual expenditure on the EPP is only around £6bn. Some of the costs, however, appear in cost centres outside the EPP so are effectively hidden costs. Unproductive project costs from delay in the year may also not show up within the year, though they will need to be covered eventually to get the same level of capability. Hence the inputs of £6bn per year will not produce £6bn of productive output as planned, but a level reduced by unproductive cost increases. These impacts are illustrated in Figure 7-13 below. For intended productive input of £6bn in expenditure, the effect post-delay may be a level as low as £4bn that will prove valuable, once unproductive costs across the system are taken into account.
Annual system cost of EPP delays
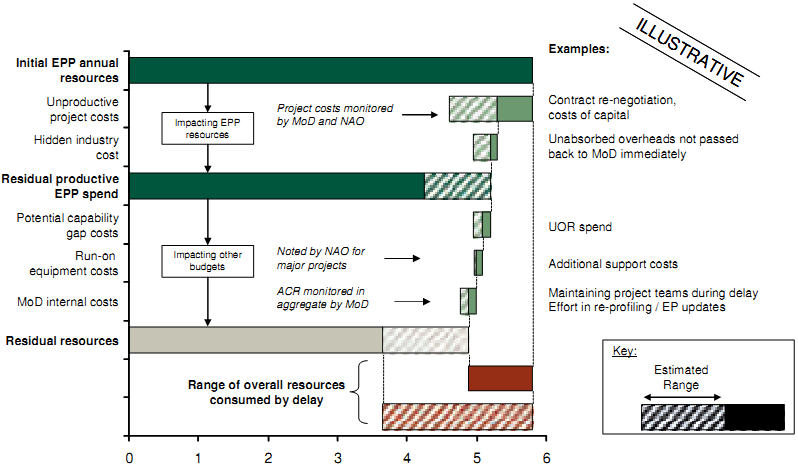
Source: CMIS (Feb 2009); NAO Major project reports; Review team analysis; DE&S management data; Company annual reports; Press
Figure 7-13: Conceptual system costs of delay
__________________________________________________________________________________________________________________________________
77 It should be noted that whilst some unproductive project costs are incurred in directly overcoming technical issues in developing the capability, others are incurred essentially as a result of Departmental behaviour in managing the portfolio of projects underway