10.2.1. Scale of forces, equipment and support spending
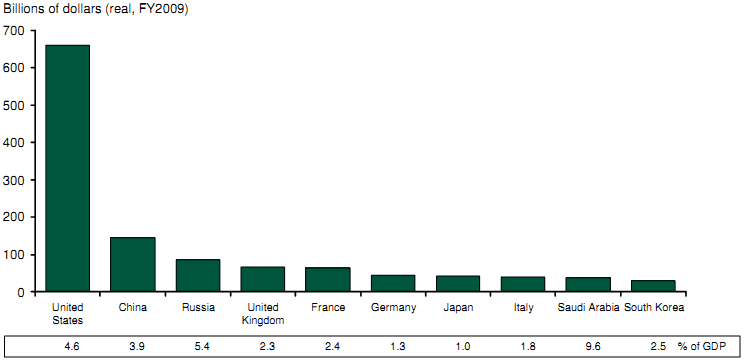
The UK has the fourth largest national defence expenditure in the world with net cash expenditure in 2007-08 of £33.5bn117 ($66bn118). With a defence budget of $660bn, equivalent to the next 45 highest spending nations combined, the US has the largest budget, followed by China ($145bn) and Russia ($85bn), as shown in Figure 10-1.
Defence expenditure (2007)
Note: *Data for the USA including funding for ongoing military operations and nuclear weapons
Source: Centre for Arms Control and Non-Proliferation; IMF; Review team analysis
Figure 10-1: Defence expenditure for the top fourteen countries (2008)
UK defence expenditure represents 2.3% of national GDP. As can be seen in Table 10-1, this is significantly less than the equivalent proportion in the USA (4.6%), marginally less than France (2.4%), but more than both Italy (1.8%) and Germany (1.3%).
UK spending on equipment spending in 2007 was 23% of defence expenditure119, comparable to the proportions in US (26%), France (21%) and Australia (18%).
In 2007 the MoD had a combined military and civilian manpower of 294,000, just less than those of the equivalent organisations in France and Japan.
Country | Military expenditure (2007*) | Equipment expenditure (2007*) | Number of active projects | Average project*** cost (£bn) | Average project*** duration (mnths) | Man-power ('000 s) 2007 | |||
| $bn* | % of GDP | $bn** | % of Defence | All | Of over £200m |
|
|
|
UK | 66 | 2.3% | 15^ | 23% | 118 | 39 | 1.0 | 63 | 294 |
USA | 66 | 4.6% | 171 | 26% | n/a | 95 | 9.5 | n/a | 2,042 |
France | 63 | 2.4% | 14 | 21% | n/a | n/a | n/a | n/a | c.360 (troops only) |
Germany | 44 | 1.3% | 6 | 15% | n/a | n/a | n/a | n/a | c.400 |
Japan | 43 | 1.0% | 7 | 17% | 37 | 4 | 0.05 | n/a | 331^^ |
South Korea^^^ | 28 | 2.5% | 9 | 33% | n/a | n/a | n/a | n/a | c.680 (troops only) |
Canada | 16 | 1.1% | 2 | 15% | n/a | n/a | n/a | n/a | 92 |
Australia | 15 | 1.5% | 3 | 18% | 406 | 16 | 0.5 | n/a | 66 |
Note: * Fiscal year in which most months fall in 2007. Australia is average of 06/07 and 07/08, corresponding to calendar year; ** Real US FY09; *** Based on publically available project data (i.e., US 96 projects, Australia 30 projects, Japan 37 projects); ^ For consistency of sources, NATO figures are used. Note these are different from the £6bn spending on the EPP. ^^ 2008 figure; ^^^ 2006 figure
Source: Centre for Arms Control and Non-Proliferation; IMF; SIPRI military expenditure database; NATO; CMIS; DASA; National Departments of Defence; Review team analysis
Table 10-1: Overview of key international military acquisition programmes
_______________________________________________________________________________________________
117 MoD Annual Report 2007-08, p294
118 In real terms FY09 US Dollars
119 UK data expressed on a like basis with other countries. Use of consistent source data for international comparisons leads to some inconsistency with known UK data.