E.7. Modelling the EPP
An extension of the above analytical model through a possible numerical approach is outlined in Figure E-3. A model composed of individual cohorts of projects can be used to iteratively consider the EPP in each year. Each cohort of projects has a profile of expenditure and incurs particular delays and cost overruns each year. With new approved spend being added to the plan each year, this unconstrained plan is subject to budgetary constraints (analogous to the equipment review and options each planning round) to produce the final EPP for each year.
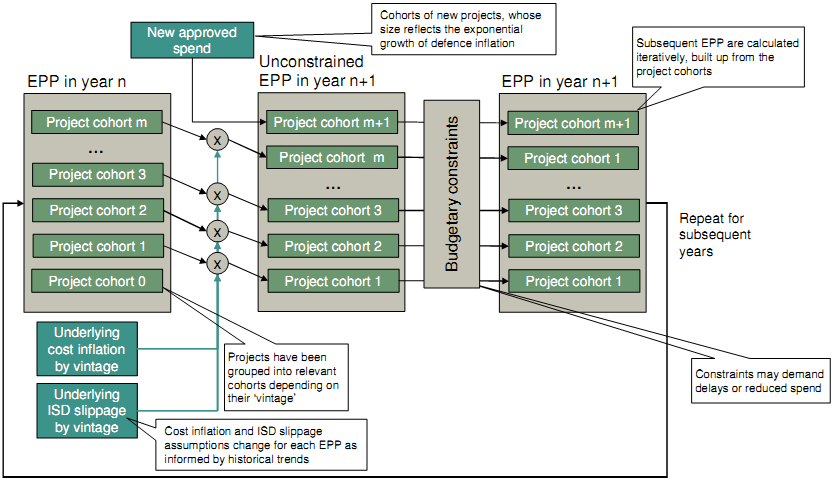
Figure E-3: Outline of a possible numerical approach
Figure E-4a shows the indicative cost and time slippage assumptions. Given these assumptions, a generalised profile of expenditure as approved at Initial Gate will evolve in each successive EPP as shown in Figure E-4b. With ISD slippages exceeding cost overruns, the profile of expenditure is stretched across a longer period than original planned with a smaller peak but a greater overall spend over the lifetime of the project to completion.
(a) Cost and time slippage assumptions | (b) Unconstrained project spend in subsequent plans |
|
|
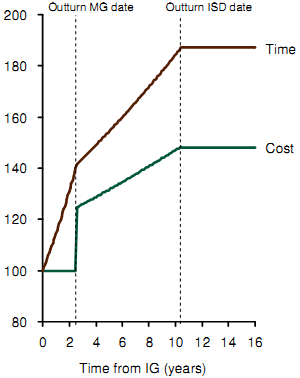
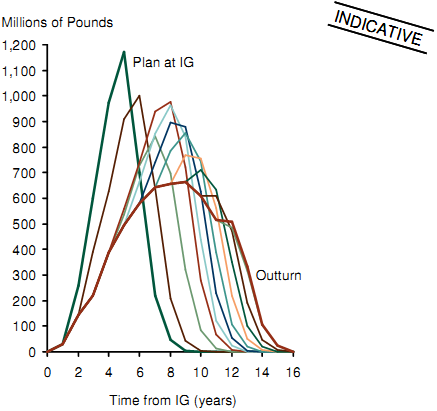
Figure E-4: (a) Example of time and cost slippage assumptions applied to the cohorts. (b) Evolution of unconstrained project spend profiles in subsequent plans as ISD slippages and cost overruns are incurred
If the same amount of expenditure is approved each year and cost and time slippages are constant, the outturn unconstrained spend will reach a steady-state. Should the outturn time and cost slippages increase for a period, then, as Figure E-5 shows, the outturn unconstrained spend will transition between two steady-states. Since it is assumed that no cost overruns are observed during the Assessment phase of a cohort of projects until their Main Gate approvals, spend initially falls because expenditure has been deferred into the future. Thereafter, spend rises when increased cost overruns post-Main Gate impact projects and reaches a higher steady-state when the legacy projects are complete. In this circumstance, outturn unconstrained expenditure is higher in the long-run because although less is spent on each cohort each year (in Figure E-5 the strips become thinner), more project cohorts are active at any one time and the total spend on each cohort is higher (the area of the strips become increases). Table E-1 summarises the effect of increasing, decreasing or stable cost overruns and project delays on the EPP.
Outturn unconstrained spend for different project cohorts past IG
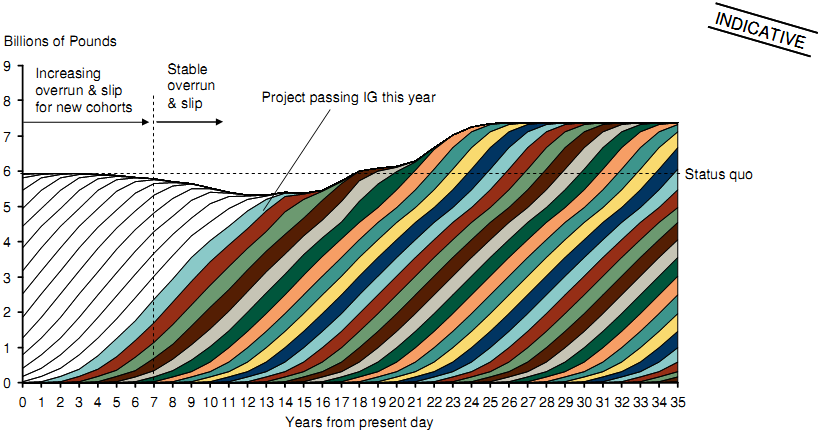
Figure E-5: Example of outturn unconstrained spend in a situation where there is increasing cost overrun and ISD slippage for new cohorts. The coloured strips represent spend each year for a particular cohort of projects approved in a certain year.
|
| Cost overrun |
|
|
|
| Overrun decreasing | Overrun stable | Overrun increasing |
Project delays | Delay decreasing | Outcome depends on relative rate of change, but likely hump subsides to lower cost programme | Programme is temporarily unaffordable | Programme becomes unaffordable relatively quickly |
| Delay stable | Programme becomes more affordable in the long term | Stable programme (so long as hopper is fed at constant rate) | Programme becomes increasingly unaffordable in the long term |
| Delay increasing | Programme becomes more affordable relatively quickly. [Temptation to start new projects to fill up the programme in the intervening years] | Programme becomes increasingly affordable (but you get less and less) | Programme becomes unaffordable, but relative rate of change in overrun / slip may mask the problem for a while |
Table E-1 : Summary of the effect of increasing, decreasing or stable cost overruns and project delays on the Equipment Plan Programme