F.4. Adjusting for changes in capability
The capability that a project actually delivers is often significantly different from the capability that was specified when the project was originally planned and approved. This will be the case if, for example, the customer specifies new requirements once a project is underway. In certain situations, trading out capability renders it possible to meet cost and/or time constraints that would otherwise be impossible; in such circumstances, changes may be deliberately introduced by programme managers.
In order to understand project performance accurately, it is necessary to make adjustments to take account of such changes. Whilst any change is likely to impact project duration and project cost, the impact on duration is generally thought to be less significant and more difficult to determine. For this reason, this study has not sought to make any adjustments to the duration data. The cost to complete a project, however, is likely to be highly sensitive to changes to the scope of the project, and it has been deemed necessary to make the appropriate corrections.
In order to determine how to correct for these changes, there are two distinct aspects to capability that need to be considered: those which are volume-related; and those which are functionality-related. In other words, the capability that a project delivers is related not only to the number of units that are produced, but also to the level of performance that each unit is capable of meeting.
For projects in the Assessment phase, relatively little data is captured on the cost changes associated to changes in the scope of a project. As a result, the functionality-related changes are ignored and the only corrections that are made concern volume-related aspects of capability. The adjusted cost change172 is calculated as shown in Equation F-1. In order to maximise the sample size, no volume changes have been assumed unless specific information has been received to the contrary.
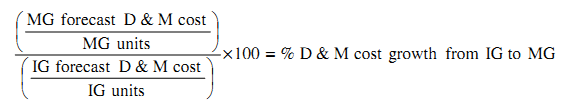
Equation F-1: Adjusted D&M cost growth during Assessment phase
More information is available regarding projects that have received Main Gate approval. For these projects, detailed data describing the variations in cost since Main Gate are captured (Table F-1). As a result, fully adjusted unit costs can be calculated as follows: given the latest forecast cost to completion, adding back the cost variations that are associated with changed functionality (but not those associated with changing volumes, nor those which are not related to changes in capability), means that it is possible to deduce the cost of delivering the project at Main Gate functionality but current volumes, as indicated in Figure F-3. By comparing the resulting unit cost with the unit cost implied by the conditions approved at Main Gate, a unit cost overrun which is adjusted for changes in capability can be calculated.
Example project
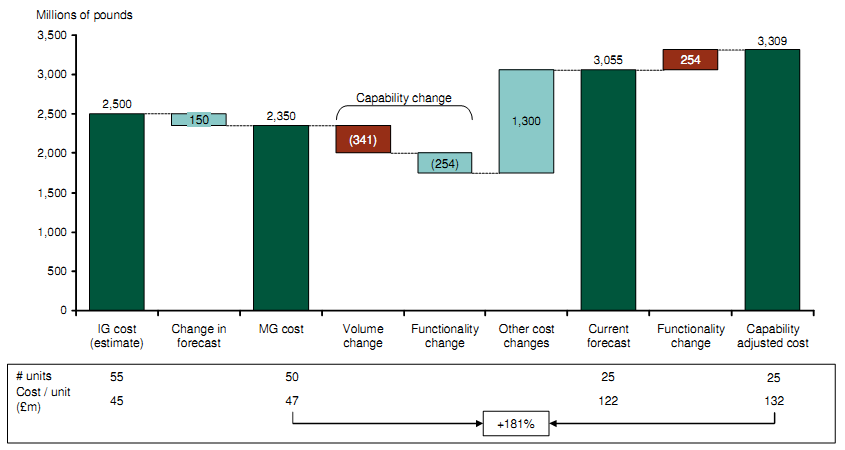
Figure F-3: Cost adjustment methodology
Adjusting for changes in project capability in this way has a significant impact on the rates of cost overrun, as shown in Figure F-4. In all instances, adjusted unit cost is higher than the corresponding unadjusted figures. This shows that, although projects on average overrun on cost, the overrun delivers less capability than was approved (at both Initial Gate and Main Gate)
MG forecast D&M cost as a % of IG forecast D&M cost – adjusted versus un-adjusted cost | Latest forecast D&M cost as a % of MG forecast D&M cost – adjusted versus un-adjusted cost* |
|
|
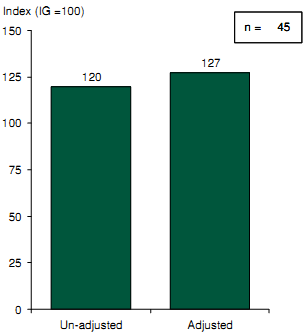
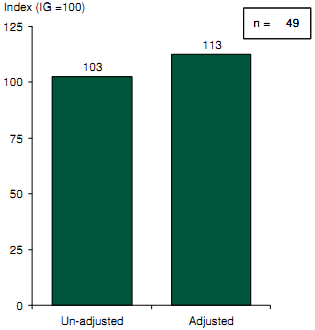
Note: * Projects that are 75% complete or greater
Source: CMIS (Feb 2009); NAO Major project reports
Figure F-4: Adjusted versus un-adjusted cost growth for Assessment phase (LHS) and D&M phase (RHS)
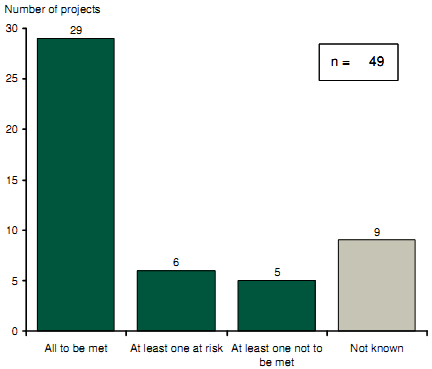
In addition to cost and duration forecasts, project Key User Requirements ("KURs") are also tracked in CMIS. These can be analysed to give an indication of whether the KURs, as defined at Main Gate, were met or are forecast to be met.
KUR status of projects - adjusted cost sample
Source: CMIS (Feb 2009)
Figure F-5: Key User Requirements met, or forecast to be met, for post Main Gate cost sample
Figure F-5 shows the latest position of KURs for the 49 projects that appear in the post Main Gate cost adjusted sample. This suggests that there are five projects that have not met, or are forecast not to meet all the Key User Requirements that were specified at Main Gate. Furthermore there are six projects for which at least one Key User Requirement is defined to be at risk of not being met.
This highlights further loss in capability that has occurred since Main Gate that should be adjusted for such that a true comparison of cost growth versus the original capability at Main Gate can be made. This is an adjustment that has not been considered in this review.
_______________________________________________________________________________________________
172 The adjustment is made to the cost of the Demonstration and Manufacture phases of the project; no corrections are applied to the cost of the Assessment phase.