F.6. Performance during the Assessment phase (pre-Main Gate) - Samples
Category A to C projects recorded in the CMIS database and NAO Major Project Reports have been used as a starting point for all Assessment phase analysis samples. Where appropriate these have been supplemented using data from IPT interviews, NAO Major Project Reports and the Investment Approvals Board (IAB).
Outturn Assessment phase duration can be calculated for all projects that have now passed Main Gate, and for which the date of both Main Gate and Initial Gate date are known, a sample of 42 projects173. Outturn Assessment phase cost data is not available in CMIS; but data presented in the NAO Major Project Reports and extracted from IAB submissions has resulted in a sample of 38 projects where both the IG forecast cost and the outturn AP cost is known.
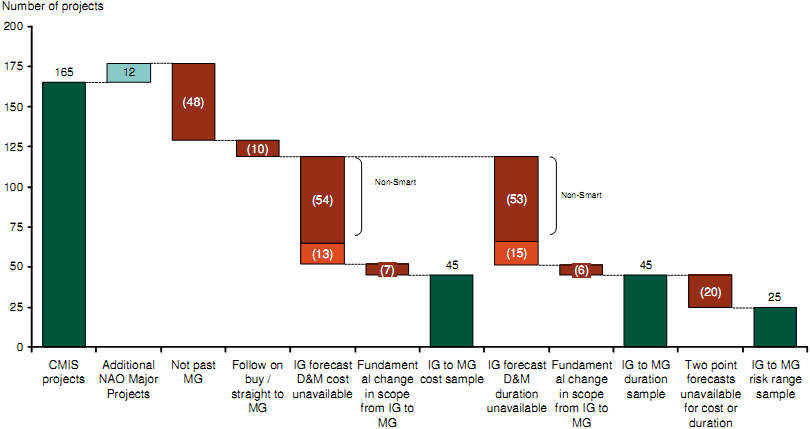
The documents submitted by each project at Initial Gate are expected to forecast an In-Service Date as well as a Main Gate date, although this is not always the case. The submissions are also supposed to forecast the total cost of the Demonstration and Manufacture phases. Where available, these forecasts can be compared with those that are made as part of the Main Gate approvals process in order to ascertain how much slippage (of both time and cost) occurs during Assessment phase (section F.6). The size of this sample size is constrained by the number of projects past MG for which IG forecasts of MG-ISD duration and D&M phase cost are available. In addition, there are a number of projects which are not suitable either because the project is a follow-on buy or because the scope has changed during the Assessment phase to such an extent that comparisons are unreasonable (see section F.3). The necessary cost forecasts are available for only 45 projects; a sample of 45 projects is available for analysis of duration slippage (see Figure F-6).
This reduces further to a sample of 25 projects for which at least the 90% forecast risk range forecast is available at IG and MG for both cost and duration.
Sample sizes used for Initial Gate to Main Gate analysis
Source: CMIS (Feb 2009); IAB; NAO Major project reports
Figure F-6: Samples sizes used for Assessment phase evolution of post MG cost and time estimates
_______________________________________________________________________________________________
173 This number excludes projects where the scope is understood to have changed so significantly that the work undertaken during the Assessment phase is fundamentally different to that which was envisaged at Initial Gate (see Section F.3).