F.7. Performance during the Demo/Manufacturing phase (MG to ISD) -Samples
Similarly, the 165 category A to C projects recorded in the CMIS database have been used as a starting point for all post Main Gate analysis samples. However, in this case an additional 12 projects appearing in NAO Major Project Reports prior to 2004 but not in CMIS can be included in the sample. Of the CMIS projects 48 are not past MG and cannot be included. Furthermore, there are 6 projects that have to be excluded due to either irresolvable inconsistencies with the data or because reasonable comparisons cannot be made (Section F.3).
This results in a sample of 123 projects for which both latest forecast and Main Gate forecast data is available (Figure F-7). This sample is used in the analysis of slippage in forecast Main Gate to In-Service Date duration following Main Gate approval.
As discussed in Section F.4 the cost forecasts can be adjusted for any changes in capability following approval. Doing so requires the variations in forecast cost to be known, in particular any "Changed Requirement" variations. For projects which achieved Main Gate approval prior to the launch of CMIS in April 2004, and which were not covered by the NAO's Major Project Reports during that time, information about cost variation is missing and it is not possible to adjusted for capability. This is the case for 39 of the 123 projects.
In order to calculate unit costs, it is also necessary to know the number of units approved both at Main Gate and at the time of the latest cost forecast. For 5 of the remaining projects, this data is unavailable. This results in a sample of 79 projects upon which the analysis of overrun in forecast D&M phase cost following Main Gate approval is carried out, as illustrated in Figure F-7.
Sample sizes used for post Main Gate analysis
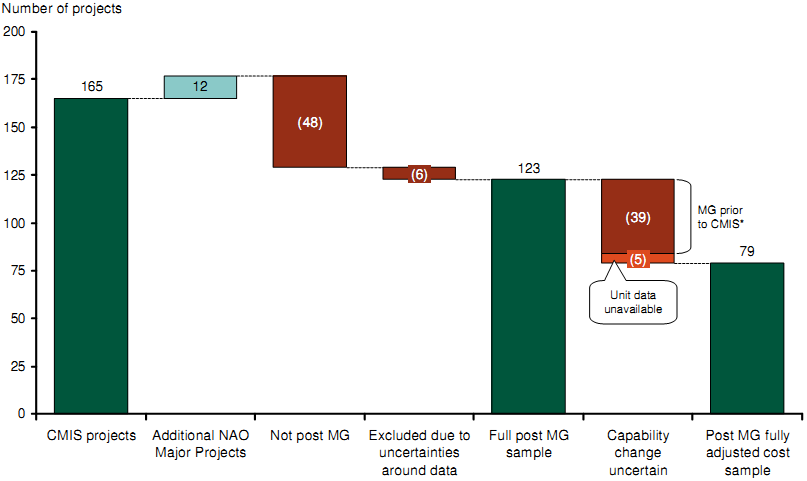
Note: * Cost variations from a change in capability prior to 2004 not available
Source: NAO Major project reports; CMIS; IAB; Interviews and analysis
Figure F-7: Samples sizes used for evaluating during the Demonstration & Manufacture phase (MG - ISD)