F.8. Analysis of performance during the Assessment phase (pre-Main Gate)
As explained in Section F.6 there are 42 projects for which Initial Gate forecasts Assessment phase duration and actual Assessment phase duration is known and there are 38 projects for which IG Assessment phase cost forecast and actual AP expenditure is known. As discussed in Section F.3 projects where there has been a significant change in scope during the Assessment phase have been excluded.
Performance during Assessment phase relative to forecasts has been calculated on a project by project basis by dividing the actual outturn duration, or cost, by the Initial Gate forecast. Overall averages for the samples have then been calculated on a straight basis (Figure F-8).
Duration of Assessment Phase relative to IG forecast | Cost of Assessment Phase relative to IG forecast |
|
|
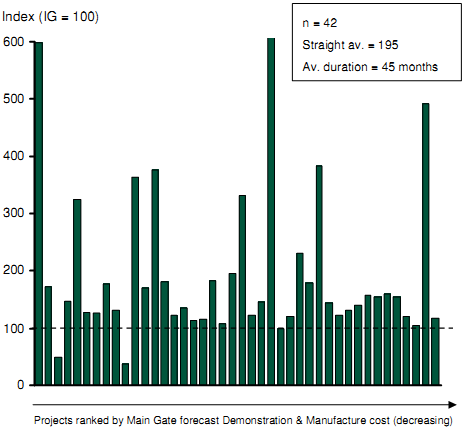
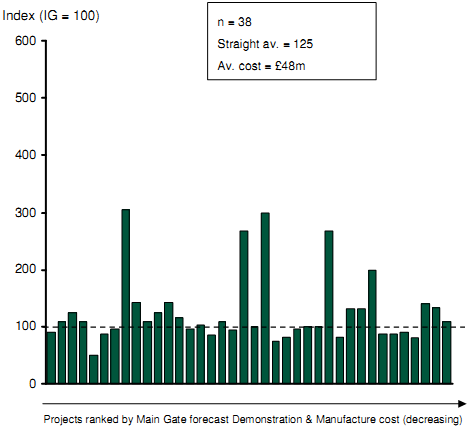
Figure F-8: Project performance during Assessment phase relative to IG forecast
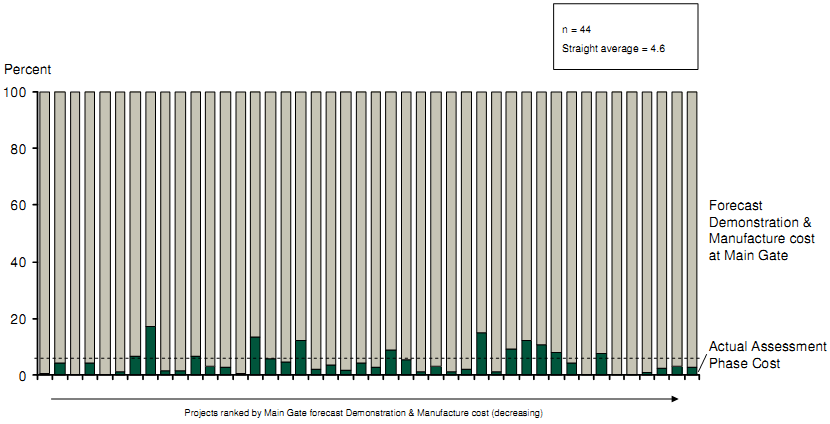
An important characteristic of a project is the proportion of expenditure dedicated to the Assessment phase as a proportion of the total cost to project completion174. There are 44 projects for which actual AP expenditure is available and this analysis can be completed; the results are shown in Figure F-9. These results show that, on straight average basis, AP expenditure contributes only c.5% of total project cost.
Assessment Phase spending as a proportion of total spend
through Assessment, Demonstration and Manufacture phases
Source: CMIS (Feb 2009); NAO Major project reports; IAB
Figure F-9: Assessment phase spending as a proportion of total forecast spending through Assessment, Demonstration & Manufacture phases
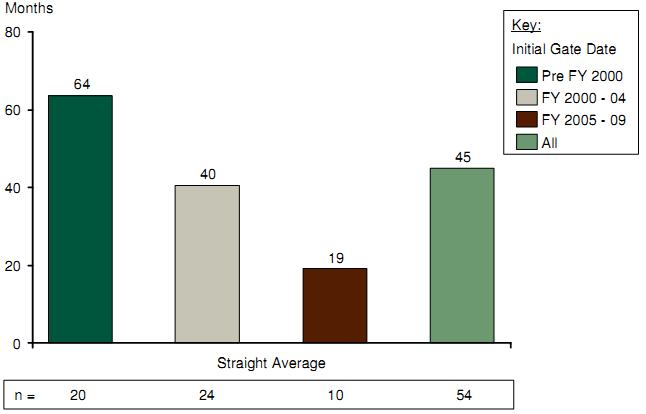
The outturn duration of Assessment phase has been analysed over time (Figure F-10). It appears that the time which projects spend in AP has been reducing over time on a straight average basis. However, since the smaller projects in the pre FY2000 sample will only appear in CMIS if spend was still occurring post April 2004, the sample is likely to be skewed towards overrunning projects. Additionally, the FY2005-09 sample will not include projects that have not yet past Main Gate (if, for example, they are overrunning). This sample may also, therefore, be subject to bias. Nonetheless, there does appear to be a trend of Assessment phase duration decreasing over time.
Duration of Assessment Phase - trend over time
Source: CMIS (Feb 2009); NAO Major project reports; IAB
Figure F-10: Outturn duration of Assessment phase - trend over time
Furthermore the changes in post Main Gate forecasts over the Assessment phase have been analysed. The analysis is based upon a sample of 45 projects where the necessary cost forecasts are available and a sample of 45 projects for duration (See Section F.6 and Figure F-6).
In this case the costs have been adjusted for any changes in capability that can be identified through changes in the number of units approved for delivery. For detailed explanation of cost adjustment see Section F.4.
The growth in forecasts have been calculated in a similar manner to above by firstly calculating the growth on an project basis, by diving the Main Gate forecast by the forecast at Initial Gate. Both the straight average of MG forecast relative to IG forecast and the average weighted by Main Gate forecast D&M cost have been calculated (Figure F-11, Figure F-12).
MG forecast duration relative to IG forecast duration
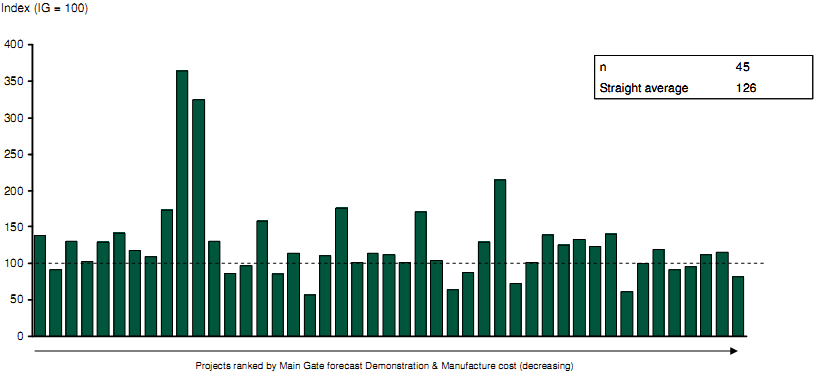
Source: CMIS (Feb 2009); NAO Major project reports; IAB
Figure F-11: Forecast Main Gate to In-Service Date duration growth over the Assessment phase
MG forecast cost to completion relative to IG forecast cost to completion
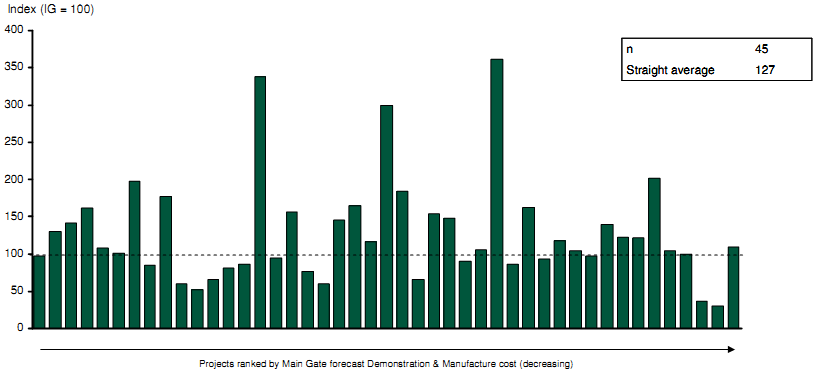
Source: CMIS (Feb 2009); IAB; NAO Major project reports; Interviews and analysis
Figure F-12: Forecast Demonstration & Manufacture phase cost growth over the Assessment phase
_______________________________________________________________________________________________
174 The total cost of Assessment, Demonstration & Manufacture expenditure phases, as forecast at Main Gate.