F.9. Project performance during the Demonstration & Manufacture phase (Main Gate to ISD) analysis
As explained in Section F.7 following data cleansing there are 123 projects that have passed Main Gate for which their performance during the Demonstration and Manufacture phase can be analysed. This sample reduces further to 79 projects when considering adjusted cost (Section F.4).
Project performance in terms of duration has been calculated on a project-by-project basis by dividing the latest forecast, or actual, duration from Main Gate to In-Service Date by the Main Gate forecast MG to ISD duration. It should be noted that this only looks at the duration up to In-Service Date and projects can still slip after this. As spending continues after ISD the question of whether duration to ISD is an appropriate measure of performance.
Latest forecast costs have been adjusted to reflect original capability at Main Gate approval both in terms of number of units approved for delivery and any changes in requirements, as described in detail in Section F.4. Following adjustment cost performance is calculated in a similar manner by dividing the latest forecast, or actual, Demonstration and Manufacture phase cost by the Main Gate forecast D&M phase cost.
Once again both the straight average and the average weighted by Main Gate forecast D&M cost of the project-by-project performance have been calculated for the duration and cost samples. The results of which are shown below in Table F-2.
| Average cost (£m) | ||
| Estimate at Main Gate50 | 48 | 799 |
| Straight average increase on a project-by-project basis to Latest50 | +34% (16 months) | +8% (£64m) |
| Sample size | 123 | 79 |
Source: CMIS, Review team analysis
Table F-2: Project performance during the Demonstration & Manufacture phase
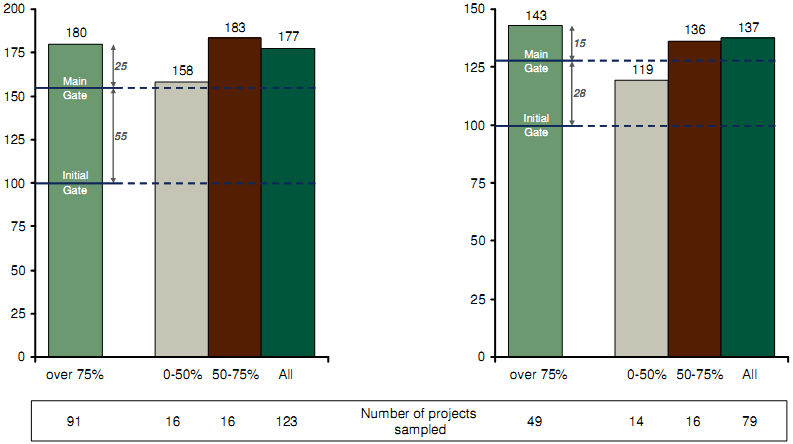
Currently both the duration and cost samples have no restrictions, with the exception of that by their nature projects must have passed through Main Gate. As a result the samples include projects that might be very young and not yet been subject to delays and cost increases. This can be illustrated by classifying projects based on project completion, which is defined as time elapsed from Main Gate to date of latest forecast as a proportion of latest forecast MG to ISD duration. The results of segmenting the samples in this way is shown in Figure F-13, which clearly illustrates that projects less than 50% complete are currently performing significantly better than the average.
As a result all further analysis, upon which the reviews conclusions have been based, has been carried out using a duration sample of 91 projects that are over 75% complete and a cost sample of 49 projects that that are also over 75% complete (Table F-3).
| Average duration (months, MG50 - ISD)50 | Average cost of D&M phase (£m) | |
| Estimate at Main Gate50 | 44 | 748 |
| Straight average increase on a project-by-project basis to Latest50 (75% mature) | +37% (16 months) | +13% (£97m) |
| Sample size | 91 | 49 |
Source: CMIS, Review team analysis
Table F-3: Average duration and cost of Demonstration and Manufacture phase
| Latest forecast project duration overrun by Maturity | Latest forecast project cost overrun by Maturity |
| Index of project duration (Forecast at Main Gate50 = 155) | Index of adjusted unit cost (Forecast at Main Gate50 = 128) |
|
| |
Note: Straight average shown
Source: CMIS (Feb 2009); NAO Major project reports; IAB; Review team analysis
Figure F-13: Project duration and cost overrun for projects post Main Gate
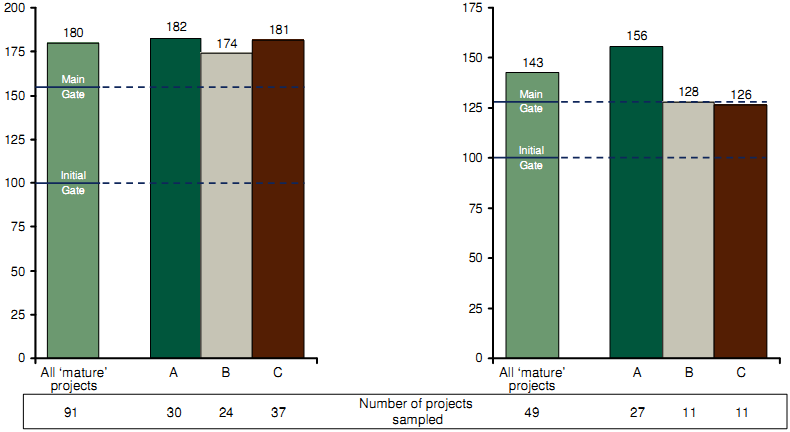
Furthermore the samples can be segmented by project Category, which allows for the effect of size to be considered (Figure F-14).
| Latest forecast project duration overrun by Category* | Latest forecast project cost overrun by Category |
| Index of project duration (Forecast at Main Gate50 = 155) | Index of adjusted unit cost (Forecast at Main Gate50 = 128) |
|
| |
Note: Straight average shown; Projects more than 75% complete at latest forecast; * Analysis of difference by segment is based on growth during D&M phase only
Source: CMIS (Feb 2009); NAO Major project reports; IAB; Review team analysis
Figure F-14: Project duration and cost overrun for projects post Main Gate by Category (over 75% complete)
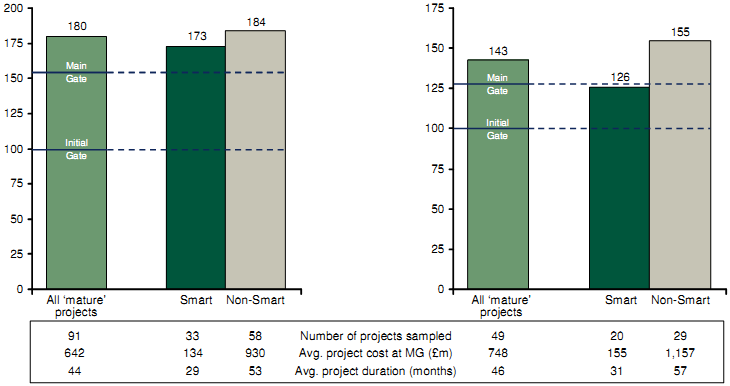
The samples can also be segmented into Smart and non-Smart projects175 for comparison (Figure F-15).
| Latest forecast project duration overrun by Smart / Non-Smart* | Latest forecast project cost overrun by Smart / Non-Smart* |
| Index of project duration (Forecast at Main Gate50 = 155) | Index of adjusted unit cost (Forecast at Main Gate50 = 128) |
|
| |
Note: Straight average shown; Projects more than 75% complete at latest forecast; * Analysis of difference by segment is based on growth during D&M phase only. Non-Smart projects include projects post 1999 deemed to have followed non-Smart principles, e.g. follow on buys of Non-Smart projects
Source: CMIS (Feb 2009); NAO Major project reports; IAB; Review team analysis
Figure F-15: Project duration and cost overrun for projects post Main Gate by Smart/Non-Smart (over 75% complete)
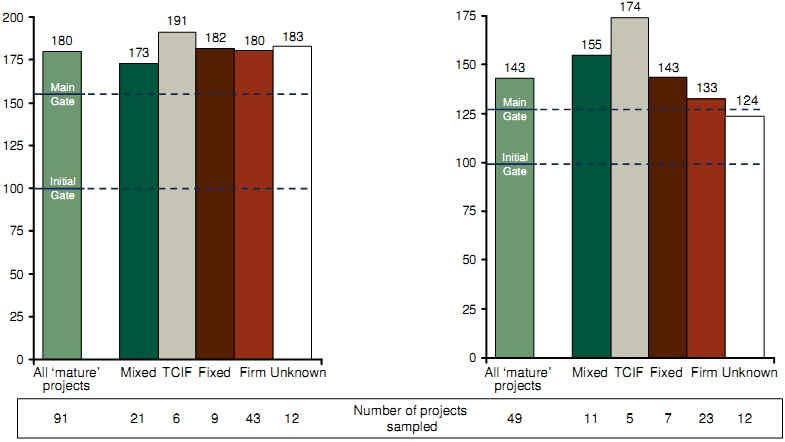
Comparison of performance can also be examined across different contract types (Figure F-16).
| Latest forecast project duration overrun by contract type* | Latest forecast project cost overrun by contract type* |
| Index of project duration (Forecast at Main Gate50 = 155) | Index of adjusted unit cost (Forecast at Main Gate50 = 128) |
|
| |
Note: Straight average shown; Projects more than 75% complete at latest forecast; * Analysis of difference by segment is based on growth during D&M phase only
Source: CMIS (Feb 2009); NAO Major project reports; IAB; Review team analysis
Figure F-16: Project duration and cost overrun for projects post Main Gate by contract type (over 75% complete)
It is also of interest to examine the slippage in duration post Main Gate relative to the TRL (see Section F.13) that was included in the Main Gate project approval. This can be analysed for a sample of 14 projects (Figure F-17).
Forecast duration vs. TRL
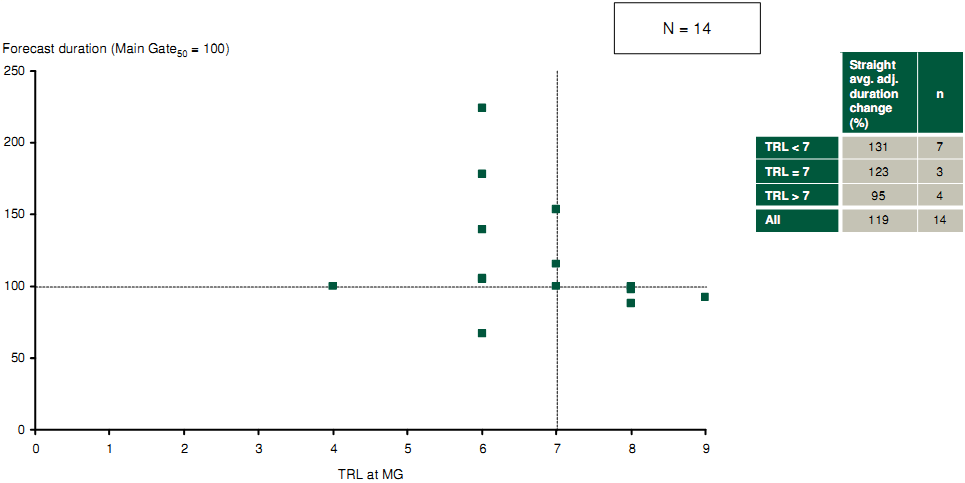
Note: Projects more than 75% complete at latest forecast
Source: CMIS (Feb 2009); IPT Interviews; IAB; Review team analysis
Figure F-17: Project duration overrun for projects post Main Gate by Technical Readiness Level
_______________________________________________________________________________________________
175 Non-Smart projects include projects post 1999 deemed to have followed non-Smart principles, e.g., follow on buys of non-Smart projects