F.10. End-to-end project performance analysis
In additional to looking at project performance during Assessment phase and Demonstration & Manufacture phase separately it is possible for a smaller subset of projects to examine performance straight through from Initial Gate to latest forecast completion.
Since this is limited to a subset of projects post Main Gate that are over 75% and have Initial Gate Forecasts for both Assessment phase and Demonstration & Manufacture the sample for duration is only 23 projects and for cost it is only 15 projects.
As previously the performance is calculated on a project-by-project basis by dividing the latest forecast, or actual, performance across from Initial Gate to completion by the Initial Gate forecast for Initial Gate to completion. Likewise, the costs are adjusted for capability as before. The results of this analysis, along with the straight average can be seen below (Figure F-18).
The results should be interpreted with caution, however, as fairly small samples might not be representative of reality overall.
|
|
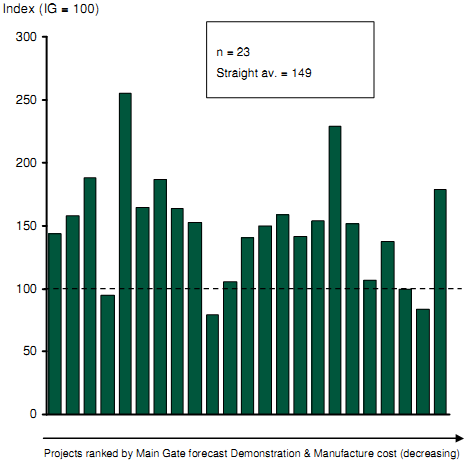
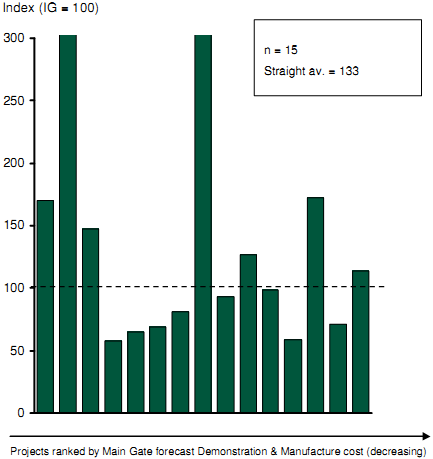
Note: Projects that are 75% complete or greater
Figure F-18: Percentage duration and cost overrun from IG forecast to latest forecast (over 75% complete)
In all instances where a hypothesis has been made the statistical significance has been tested. Two types of tests have been used: The two tailed t-test to test whether a mean of a sample population is statistically significant from a null mean and the one tailed t-test to test the significance of a difference in a specified direction between two means from independent samples with unequal variances.