G.2. Unproductive project costs
The Review has endeavoured to estimate the scale of cost associated with delays in the Equipment Programme.
Unproductive project costs are the direct and indirect costs captured within the budget for the particular project, for example, those arising from contract re-negotiation (direct) or changes to the cost of capital charge (indirect).
Considering only projects that are pre-ISD181 where a forecast of adjusted cost overrun has been determined, as shown in Figure G-1, suggests a relationship between percentage cost overrun182 relative to MG50 approved cost and ISD slippage (in months).
Latest forecast of adjusted cost overrun and ISD slippage for pre-ISD projects
Latest forecast adjusted cost overrun since MG (%)
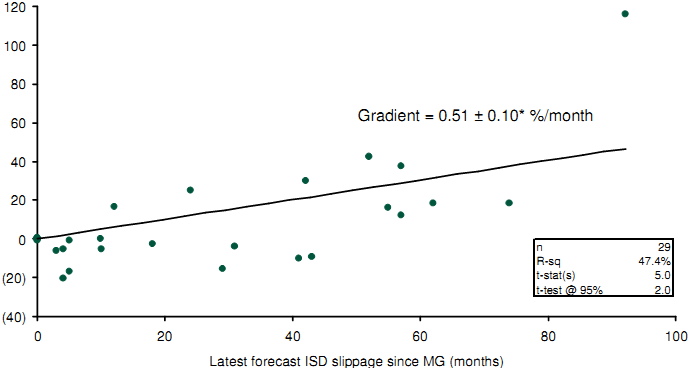
Latest forecast ISD slippage since MG (months)
Note: * Standard error
Source: NAO Major Projects Reports; CMIS (February 2009)
Figure G-1 : Latest forecast of adjusted cost overrun and ISD slippage for pre-ISD projects since Main Gate
Regression indicates that:
• cost to the MoD increases at c.0.5% of MG approved cost per month of delay. Statistically, it is possible to say with c.95% confidence that the cost of delay per month is in the range 0.3% - 0.7% of MG approved cost per month of delay; and
• forecast adjusted cost overruns not associated with forecast ISD slippages (i.e., the intercept of the line in Figure G-1) are statistically not different from zero at 95% probability. Therefore, it can statistically stated that cost overruns are generally associated with delay, and do not generally arise independent of delay.
As a result, it is possible to generalise from this per project analysis using known annual slip in the portfolio of MoD projects to a cost of delay across the entire MOD portfolio. This analysis is set out in Table G-3.
Average cost overrun as a result of delay (% of Main Gate50 approved cost per month) | 0.3% - 0.7% |
Average delay per project per year (months p.a.) | 2.5 |
Non-delay related cost overrun (% of Main Gate50 approved cost) | Nil183 |
Total approved cost at Main Gate50 of all active Category A-C projects in CMIS (£bn) | 70 |
Total unproductive project costs (£bn) | 0.5 - 1.2 |
Source: Review team analysis
Table G-3: Estimates of total unproductive project costs per year
_______________________________________________________________________________________________
181 In-service projects are excluded to avoid the influence of cost overruns declared where there can by definition be no slippage of ISD
182 Assessed as per unit costs, adjusted for capability
183 Not statistically significant at 95% probability