Project snapshot-Budget expended and project maturity progress
2.8 The second snapshot, Figure 3, sets out each project's budgeted cost expended against the project's maturity score progress.59 As noted previously, Figure 2 shows that, for most projects, the budgeted cost expended is broadly in line with the proportion of time that has elapsed in the project's schedule. However, Figure 3 shows that the project maturity score progress leads budgeted cost expended for the majority of the projects, and can vary significantly when compared to the budgeted cost expended.
2.9 This variance is a result of projects being awarded 50 per cent of the total maturity score by project managers at Second Pass Approval, which is normally prior to entering into a contract and making contractual payments. While both the project's maturity score progress and budgeted cost expended are indicators of a project's overall performance, by benchmarking the project maturity score progress against the budgeted cost expended, the variance provides an indication of the potential front-loading of the maturity score.
2.10 Projects where an approximate differential of 20 per cent existed at 30 June 2011 include: AWD Ships; MRH90 Helicopters; Overlander Vehicles; LHD Ships; Joint Strike Fighter; C-17 Heavy Airlift; Hornet Refurb; Next Gen Satellite; HF Modernisation; SM-2 Missile; Additional Chinook; ANZAC ASMD 2B; ANZAC ASMD 2A; 155mm Howitzer; and Battle Comm. Sys.
2.11 This analysis provides an indication of projects where overly optimistic assessments of a project's maturity may have been made, particularly during the early stages of a project's life cycle.
Figure 3
Project snapshot-Budget expended and project maturity progress (percentage)
| |
|
|
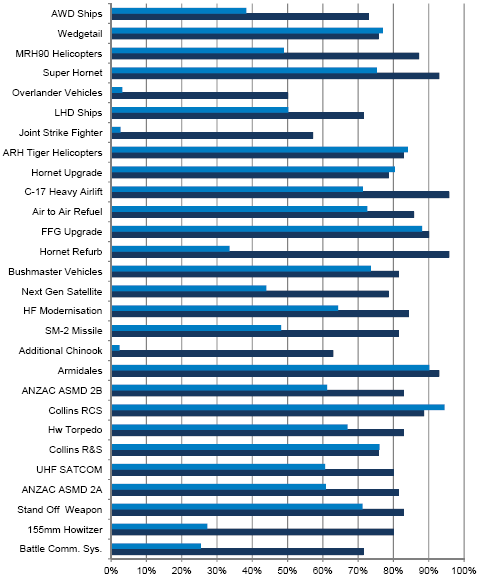
 Budget Expended
 Project Maturity Progress
__________________________________________________________________________________
59 The DMO have advised that the project maturity score concept was not designed for a strictly linear representation of a project's progress. However, the ANAO's analysis has utilised a linear representation for comparative purposes in Figures 3, 8, and 12.