9. United States PPP Financing or Delivery of Road Projects by Project Type
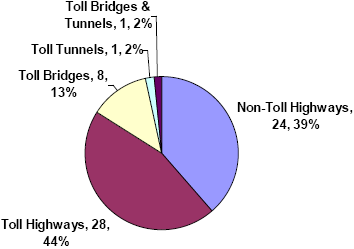
There are 62 PPP road projects In the United States representing $41.5 billion, as listed in Exhibit 19. Exhibit 20 displays the distribution of these projects by project type. As shown in Exhibit 20:
• Most of the U.S. road projects are for toll and non-toll highways, representing 44 percent and 39 percent of the total number of projects, respectively.
• In terms of project costs, the largest type of PPP road project is toll highway, representing 62 percent of total cost.
• Non-toll highway projects account for only 19 percent of total cost, since toll highway projects are often much larger than their non-toll highway counterparts.
At just over $900 million each, toll highway projects are about three times the cost of non-toll highway projects, according to Exhibit 19.
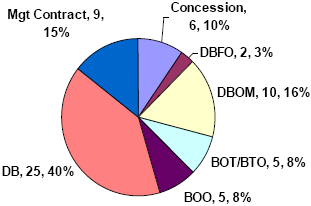
Exhibit 21 displays the distribution of U.S. PPP road projects by contract type. As shown in Exhibit 21:
• Most of the U.S. road projects involve DB and DBOM contracts with DB the largest contract type at 40 percent of the projects and 34 percent of the costs. These PPP contracts include both toll highway and non-toll highway projects.
• While DBOM projects represent only 16 percent of the total number of PPP projects in the U.S., they amount to 37 percent of the total costs. This is because DBOM projects at $1.6 billion each are about three times the size of their DB
counterparts, with contract terms of up to 20-30 years.
• The third most frequently used contracting method is Management Contract at 15 percent. These are relatively small non-toll highway projects in terms of cost, which is reflected by the small percentage (1 percent) of total costs accounted for by Management Contract projects, whose terms are typically from 5-7 years.
• While there are fewer Concession and DBFO contracts in the U.S., their average cost is significantly higher than their DB counterparts, particularly Concession contracts at about $1.3 billion each.
When compared to the rest of the world, the U.S. experience in PPPs shows a much greater use of DB, DBOM, and Management Contract approaches to deliver road projects. By contrast, particularly in Europe, Asia & Far East, and Latin America & Caribbean, there is much greater use of Concession and BOT/BOT contracting to deliver road projects. Within North America, Mexico also makes greater use of Concession contracts for its toll highway projects than the U.S.
Worldwide, the United States has the vast majority of the DB and Management Contract road projects. While not extensively used in any region, BOO is also used more in the U.S. than elsewhere, particularly for small projects involving toll bridges. In terms of average project cost, PPP road projects in the United States are about the same size as in Europe and Asia & Far East at about $670-690 million.
Exhibit 19 - United States Road Projects Planned or Completed since 1985 by Project Type and Contract Type*
| Project Type | Contract Type | Number | Percent | $ Billion | Percent | $B/Project |
| Non-Toll | ||||||
| Highways | Concession | 0 | 0% | $0.0 | 0% | N/A |
| 0 | 0% | $0.0 | 0% | N/A | ||
| 4 | 17% | $1.1 | 13% | $0.264 | ||
| 0 | 0% | $0.0 | 0% | N/A | ||
| 0 | 0% | $0.0 | 0% | N/A | ||
| 12 | 50% | $6.4 | 81% | $0.533 | ||
| Mgt Contract | 8 | 33% | $0.5 | 6% | $0.061 | |
| Subtotal | 24 | 100% | $7.9 | 100% | $0.331 | |
| Toll Highways | Concession | 5 | 18% | $5.7 | 22% | $1.140 |
| 2 | 7% | $1.5 | 6% | $0.765 | ||
| 5 | 18% | $10.5 | 41% | $2.098 | ||
| 3 | 11% | $1.2 | 4% | $0.386 | ||
| 0 | 0% | $0.0 | 0% | N/A | ||
| 12 | 43% | $6.8 | 26% | $0.565 | ||
| Mgt Contract | 1 | 4% | $0.1 | 0% | N/A | |
| Subtotal | 28 | 100% | $25.8 | 100% | $0.920 | |
| Toll Bridges | Concession | 1 | 13% | $1.8 | 57% | $1.800 |
| 0 | 0% | $0.0 | 0% | N/A | ||
| 0 | 0% | $0.0 | 0% | N/A | ||
| 2 | 25% | $0.4 | 13% | $0.208 | ||
| 4 | 50% | $0.1 | 3% | $0.021 | ||
| 1 | 13% | $0.9 | 27% | $0.860 | ||
| Mgt Contract | 0 | 0% | $0.0 | 0% | N/A | |
| Subtotal | 8 | 100% | $3.2 | 100% | $0.395 | |
| Toll Tunnels | Concession | 0 | 0% | $0.0 | 0% | N/A |
| 0 | 0% | $0.0 | 0% | N/A | ||
| 1 | 100% | $4.0 | 100% | $4.000 | ||
| 0 | 0% | $0.0 | 0% | N/A | ||
| 0 | 0% | $0.0 | 0% | N/A | ||
| 0 | 0% | $0.0 | 0% | N/A | ||
| Mgt Contract | 0 | 0% | $0.0 | 0% | N/A | |
| Subtotal | 1 | 100% | $4.0 | 100% | $4.000 | |
| Toll Bridges & | ||||||
| Tunnels | Concession | 0 | 0% | $0.0 | 0% | N/A |
| 0 | 0% | $0.0 | 0% | N/A | ||
| 0 | 0% | $0.0 | 0% | N/A | ||
| 0 | 0% | $0.0 | 0% | N/A | ||
| 1 | 100% | $0.6 | 100% | $0.600 | ||
| 0 | 0% | $0.0 | 0% | N/A | ||
| Mgt Contract | 0 | 0% | $0.0 | 0% | N/A | |
| Subtotal | 1 | 100% | $0.6 | 100% | $0.600 | |
| Total Road | ||||||
| Projects in U.S. | Concession | 6 | 10% | $7.5 | 18% | $1.250 |
| 2 | 3% | $1.5 | 4% | $0.765 | ||
| 10 | 16% | $15.5 | 37% | $1.555 | ||
| 5 | 8% | $1.6 | 4% | $0.315 | ||
| 5 | 8% | $0.7 | 2% | $0.137 | ||
| 25 | 40% | $14.0 | 34% | $0.562 | ||
| Mgt Contract | 9 | 15% | $0.6 | 1% | $0.066 | |
| Total | 62 | 100% | $41.5 | 100% | $0.669 |
* Omits projects included in PWF database that lack sufficient information to determine cost
Exhibit 20 - United States Road Projects Planned or Completed since 1985 by Project Type*
| (Projects)
|
| ($ Billions)
|
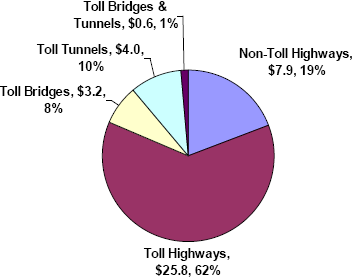
* Omits projects included in PWF database that lack sufficient information to determine cost
Exhibit 21 -United States Road Projects Planned or Completed since 1985 by Contract Type*
| (Projects)
|
| ($ Billions)
|
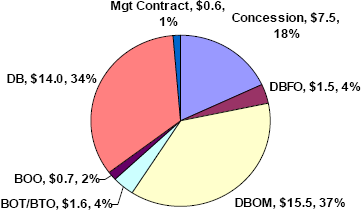
* Omits projects included in PWF database that lack sufficient information to determine cost