(3) Municipalities hit from on all sides
Notwithstanding the fiscal woes of the federal and provincial governments in the 1980s and 1990s, the largest roadblock in the way of providing an adequate supply of infrastructure over the past decade has been at the local government level. Given that municipal governments have no independent status of their own, their power to spend and raise revenues is limited to what is granted to them in provincial legislation. And, while cities have been given more room to wiggle in recent years, provinces still keep a tight rein on municipal legislative and taxing powers. Even in the few areas where cities do enjoy some authority, such as in levying property taxes, development charges and user fees, provincial governments have the right to impose restrictions on what goods and services can be taxed and at what rate. Furthermore, unlike their federal and provincial counterparts, they are not permitted to run operating deficits - even pro-cyclically.
The 1990s were a particularly difficult decade for Canada's municipalities. As part of their plans to cut back spending broadly, the federal and provincial governments passed some of the pain down the line in the form of reductions in grants. Unfortunately, for local governments, there was nobody left to pass the buck to, so they endured the largest negative impact. If that wasn't enough, municipalities were asked to take on added responsibilities, both directly through downloading, and indirectly, through other governments vacating certain service areas. On the infrastructure front, municipalities found themselves with jurisdiction over municipal airports, local ports, local harbours, ferries, transit, and, social housing. And, while there are good arguments for de-centralizing decision-making authority to the government nearest the taxpayer, many of these services were not handed over with increased access to funding and/or greater flexibility in service delivery.
Reductions in grants and limited fiscal and administrative flexibility have not been the only headaches for local governments. Own-source revenues were also held back by municipalities' heavy reliance on the property tax. Indeed, the property tax boasts some positive features, notably its relative stability and predictability. However, there is a good argument that it is regressive in nature, as the tax is not closely linked to ability to pay. And, property taxes are not only tied to a revenue source (i.e., real estate), that tends to respond more slowly to annual changes in economic activity than does incomes, but market driven increases in property taxes do not translate into increased revenues unless there is "true" increases in new assessments or the tax rate is increased. Hence, the yield for property taxes is often inadequate to meet the growing spending requirements of municipal governments.
DISTRIBUTION OF MUNICIPAL EXPENDITURES, CANADA Percentage of total spending | ||
| 1988 | 2001 |
General administration Protection Transportation Health Social Services Education Resource conservation Environment Recreation/culture Housing Regional planning Debt charges Other | 9.9 14.8 22.3 2.0 7.4 0.4 2.1 14.6 11.6 1.8 2.1 9.5 1.6 | 11.0 15.9 19.8 2.0 12.6 0.4 2.0 14.0 11.1 2.6 2.2 5.9 0.5 |
Total | 100.0 | 100.0 |
Source: Kitchen, Harry M. and Enid Slack, Canadian Tax Journal (2003), vol. 51, no. 6, 2221; Statistics Canada | ||
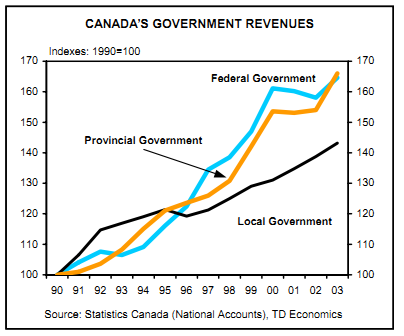
The accompanying exhibits provide a good snapshot of local governments revenue woes in recent years. Federal and provincial governments - who benefit from a much larger array of revenue-raising tools - enjoyed a near 70-per-cent gain in revenues since 1990 compared to about 45 per cent at the local level. But, despite the weakness of property tax assessments in the early-to-mid 1990s, the property tax now accounts for a whopping 52 per cent of total local revenues, up 4 percentage points from 1988.16 In contrast, the share of total grants in municipal revenues fell from 23 per cent to 17 per cent over the period.17 As municipalities' revenue mix changed, so too did their spending distribution. In particular, a greater share of each municipal revenue dollar was directed to social services and housing - largely reflecting provincial downloading of these services in Ontario - general administration and protection.
DISTRIBUTION OF MUNICIPAL REVENUE SOURCES, CANADA Percentage of total revenue | ||
| 1988 | 2001 |
Own source Property taxes Other taxes User fees Investment income Other |
|
|
48.6 1.4 20.0 6.0 1.1 | 52.2 1.3 23.0 4.9 1.6 | |
Total own-source revenue | 77.1 | 83.0 |
Grants Unconditional grants Conditional grants Federal Provincial |
|
|
5.8 17.1 0.7 16.4 | 2.4 14.6 0.4 14.2 | |
Total grants | 22.9 | 17.0 |
Total revenue | 100.0 | 100.0 |
Source: Kitchen, Harry M. and Enid Slack, Canadian Tax Journal | ||