Indifference Points
1.32 The Spreadsheet uses Indifference Points to demonstrate the level of change required in the value of individual inputs to erode to zero the net present value difference between the PFI Option and the Conventional Procurement Option, thus making the procurer indifferent between the two routes. Procuring Authorities need to deploy and interpret Indifference Point analysis carefully as it can impact their final decision.
1.33 The two graphs (see example in Chart 1.A) on the Output sheet plot how far changes in each Conventional Procurement input variable impact on the VfM. Where an input line crosses 0, the user would be indifferent between the conventional procurement and PFI. It makes the crude assumption that changes to input variables apply only to one of the procurement methods (PFI for the Unitary Charge curve, and conventional procurement for all other curves represented in the graphs), but not to both at the same time. So, for example, an increase in Capital Expenditure tested through Indifference Point analysis is assumed to occur only to the option that, unadjusted, is demonstrating better VfM. The Spreadsheet implicitly assumes that such an increase is wholly avoided by the option which, unadjusted, shows poorer VfM. The graphs should give the user a feel for how sensitive the Spreadsheet is to each variable and therefore which assumptions they may wish to focus on.
Chart 1.A: Example of the Sensitivities Graph
|
|
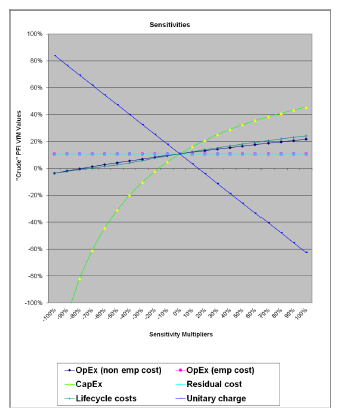
1.34 The Conventional Procurement Indifference Points in the Output sheet focus on those input variables that drive the VfM of the Conventional Procurement Option. Conversely, the PFI Indifference Point shows the level of change required in the Unitary Charge (and the resultant Return on Equity and Return on Total Project Cashflows) to erode the difference in the net present value of the two procurement methods to zero. In effect, this identifies the rate of return that would need to be required by equity capital providers to make Procuring Authorities financially indifferent between the two procurement methods that they could use. The Indifference Point of each input variable is tested by clicking the relevant Indifference Switch in the Output Sheet, or by reading it from the graph as it calculates the power at which the variable crosses zero. The Indifference Point Value for the relevant variable is shown in column L. The outputs from the IRR and IP switches can be saved using the "Stash Output" and "Copy Output sheet" buttons. Running the indifference switches will however alter the graphs.
1.35 The main focus of the indifference point analysis is, for the Conventional Procurement Option, Capital Expenditure and, for the PFI option, the Unitary Charge. Changes to other cash flows, such as Operating Costs and Transaction Costs, usually result in only marginal changes in the VfM if sensitivity analysis remains within plausible limits. The Spreadsheet does, however, enable Procuring Authorities to test combinations of changes in assumed cash flows. It does this by first, inviting Procuring Authorities to introduce changes to second-order costs such as Operating Expenditure and Transaction Costs using the " Conventional Procurement Sensitivity Multipliers" and then, having taken account of these changes, providing the Indifference Point for Capital Expenditure in the Conventional Procurement Option and Unitary Charges in the PFI Option. The multipliers in the "Conventional Procurement Sensitivity Multipliers" box in the Output sheet are used to enable modelling which focuses on the Spreadsheet's two primary decision-support variables, which are assumed to be Capital Expenditure and Unitary Charge.