Part One The scale of the challenge
1.1 Over the past ten years NHS expenditure has increased in real terms by 71 per cent to £103 billion in 2010-11, an average annual real-term increase of 5.5 per cent.
1.2 Following the Department's recognition that wider economic factors were unlikely to allow this level of real-terms increase to continue, and in anticipation of the increased demand for NHS services expected over the same period, the Department commissioned a report which was produced in March 2009 by McKinsey. The report1 provided advice on how commissioners could generate efficiency savings in the NHS and quantified a possible NHS funding gap of £10 to £15 billion in 2013-14 (assuming 0 per cent funding allocation growth and current levels of productivity and demand).
1.3 The report concluded that there was scope for efficiency improvements of between £13 billion and £20 billion, over the next 3 to 5 years.1 It recommended that, to drive efficiency savings, a nationally-supported programme, delivered through the strategic health authorities and primary care trusts, should be set up and that the Department should also take direct actions to capture some opportunities, e.g. reductions in tariff prices. In order to deliver these savings it suggested that frameworks and tools should be developed and used alongside existing mechanisms. The McKinsey report was one of a number of inputs which helped the Department to understand the scale of the challenge and actions that could be taken to address the challenge.
1.4 In May 2009, the NHS Chief Executive, Sir David Nicholson, announced that "the NHS should be prepared for a range of scenarios, including the possibility that investment will be frozen for a time. We should also plan on the assumption that we will need to realise unprecedented levels of efficiency savings between 2011 and 2014 - between £15 billion and £20 billion across the service over three years2" (Figure 2 overleaf). His report continued to say that productivity gains would be achieved by quality improvements and innovation. To support NHS organisations to improve quality of care while making these savings, the NHS Chief Executive launched the 'Quality, Innovation, Productivity and Prevention' (QIPP) challenge. Figure 3 overleaf shows the timeline for efficiency savings.
____________________________________________________________________
Figure 2 Illustrative example of the efficiency challenge for an NHS organisation
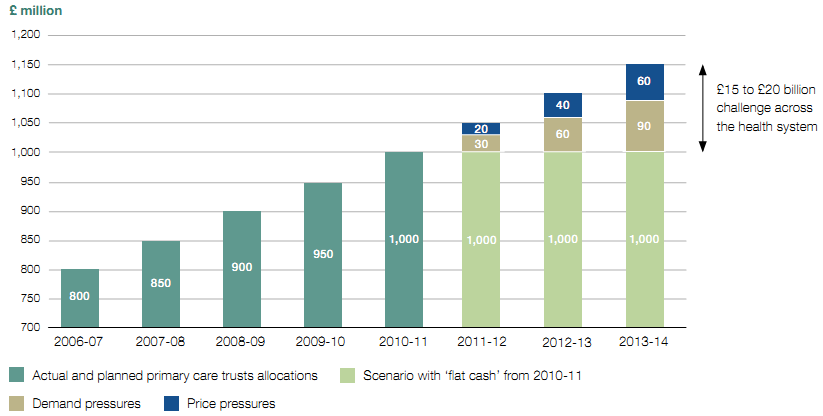
Source: Department of Health
____________________________________________________________________
____________________________________________________________________
Figure 3 Efficiency savings timeline
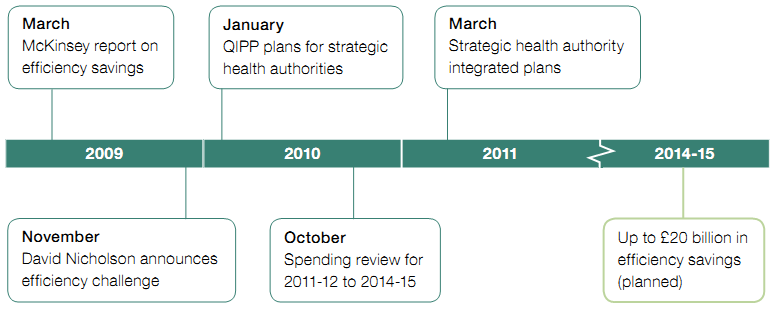
Source: National Audit Office literature review
____________________________________________________________________
1.5 A number of factors have changed since November 2009, when the original assumptions were made.
● The Spending Review3 settlement for the NHS covering the four years from 2011-12 to 2014-15, announced in October 2010, was higher than the autumn 2009 assumption, with NHS revenue budgets set to grow in real terms over the four years. The Review reflected the Government's commitment to protect health spending with the total health budget set to increase by £10.6 billion between 2011-12 and 2014-15. Within this, total revenue spending is increasing by £11.1 billion with capital falling by £0.5 billion over the same period.
● The adoption of a two-year pay freeze for most NHS staff, from 1 April 2011, will have a positive impact on efficiency between 2011-12 and 2013-14.
● The Government has committed to reducing the costs of administration across the health system by one-third by 2014-15 from an agreed 2010-11 baseline. This includes a more than 45 per cent reduction in strategic health authority and primary care trust non-provider management costs4 detailed in the health White Paper, Equity and excellence: Liberating the NHS.5
1.6 The Department's response to reviewing these developments was to retain the £20 billion challenge, but to extend the period over which the savings could be made to four years, from April 2011 to the end of 2014-15. The Department expects the savings to be reinvested in the NHS. The Department has identified three broad potential areas for savings:
● centrally-driven savings (40 per cent) through pay freezes, central budgets and management cost savings;
● provider-driven savings (40 per cent) through hospital staff productivity, procurement, primary care, mental health and community services; and
● commissioner-driven savings (20 per cent) through urgent and emergency activity, elective care, prescribing and services from non-NHS bodies.
1.7 The Department has stated that it is confident it can deliver the centrally-driven savings, but acknowledges that it may not be able to achieve all the savings intended under the efficiency programme. Many provider-driven and commissioner-driven savings will require service change, such as migrating services from hospitals into the community. The Department recognises that these savings will be the most difficult to achieve.6
_________________________________________________________________________________________________________________
1 Achieving World Class Productivity in the NHS 2009-10 - 2013-14: Detailing the Size of the Opportunity, McKinsey & Co, for the Department of Health, March 2009.
2 The Year: NHS Chief Executive's Annual Report 2008-09, Department of Health, May 2009.
3 HM Treasury, Spending Review 2010, Cm 7942, October 2010.
4 From 2011-12, primary care trusts are required to report their administration costs, which cover a wider definition of expenditure than management costs, which they reported on prior to 2011-12.
5 Department of Health, Equity and excellence: Liberating the NHS, Cm 7881, July 2010.
6 HC Public Accounts Committee, National Health Service Landscape Review, Thirty-third Report of Session 2010-12, HC 764, April 2011.