Identified QIPP savings
3.10 Strategic health authorities have identified that to meet the QIPP challenge, efficiency savings of £16.4 billion by 2014-15 will need to be made. Figure 6 shows the potential QIPP savings identified by each strategic health authority. They have identified potential efficiency savings of £17.4 billion. The potential savings identified are about 5 per cent larger than the size of the challenge identified. This provides a safety net to account for possible double counting and underperformance (slippage). Figure 7 shows how the savings to be made by strategic health authorities are spread over the period 2011-12 to 2014-15.
_________________________________________________________________________________________________________
Figure 6 Potential QIPP savings identified by strategic health authorities
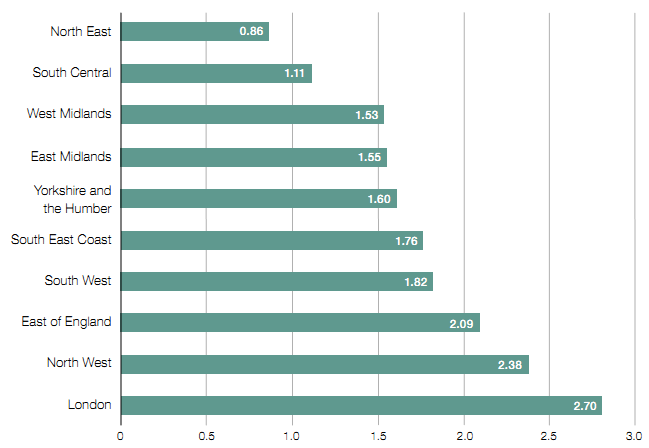
Potential efficiency savings identified (£bn)
Source: Strategic health authority integrated plans (March 2011 submissions)
_________________________________________________________________________________________________________
_________________________________________________________________________________________________________
Figure 7 Savings to be achieved over the four-year period 2011-12 to 2014-15
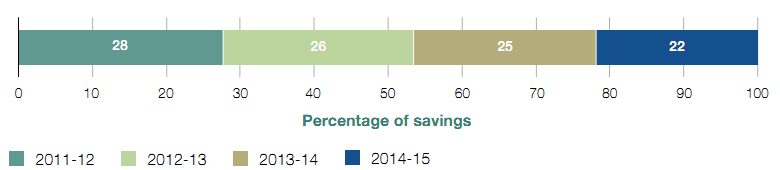
Percentage of savings
NOTE
1 Data may not sum due to rounding.
Source: Strategic health authority integrated plans (March 2011 submissions)
_________________________________________________________________________________________________________
3.11 Each strategic health authority established a number of workstreams to deliver its planned savings. The number of workstreams per authority varies between 8 and 17. The most popular workstreams are shown in Figure 8. A workstream in one region may cut across several workstreams in other regions. For example, one region has a workstream on demand and threshold management which cuts across a range of workstreams in other regions such as urgent care, planned care and long-term conditions.
_________________________________________________________________________________________________________
Figure 8 Most popular regional workstreams
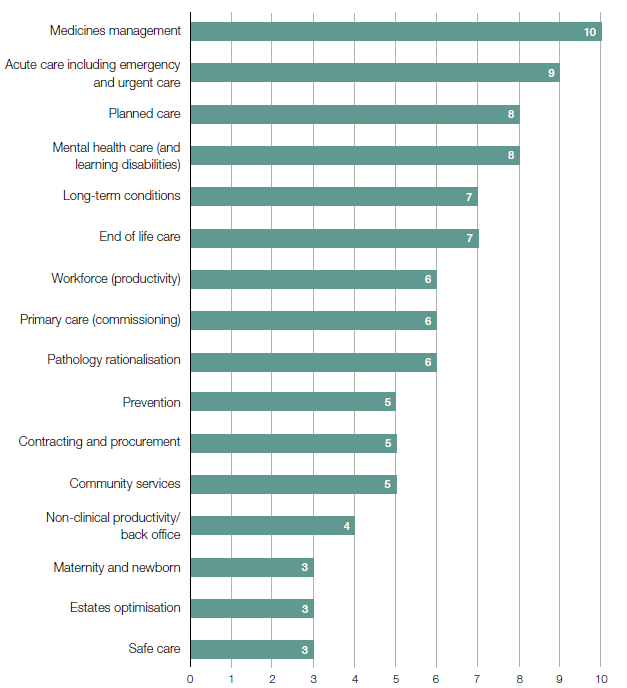
Number of strategic health authorities
NOTE
1 Workstreams covered by only one or two strategic health authorities are not shown.
Source: Strategic health authority integrated plans (March 2011 submissions)
_________________________________________________________________________________________________________
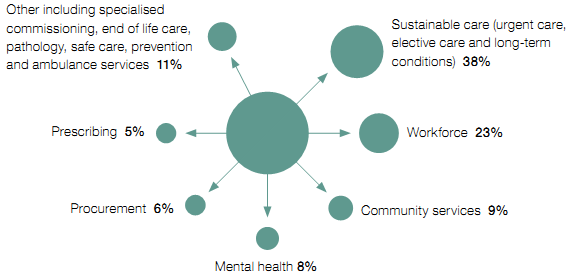
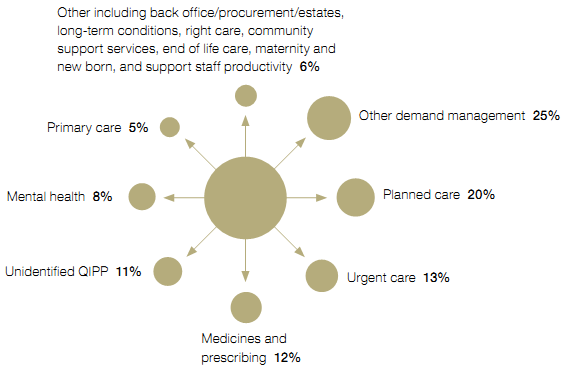
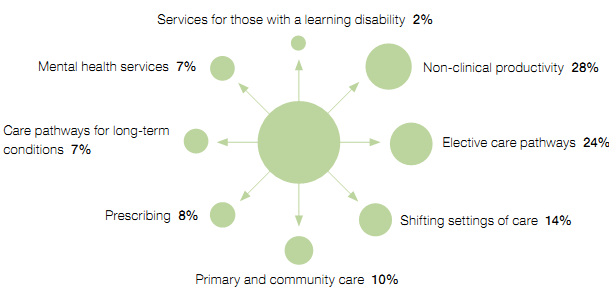
3.12 Figure 9 shows how efficiency savings are split across different workstreams for four strategic health authorities. The main areas of savings are planned care, urgent care, primary care, mental health and long-term conditions. Medicines management, or prescribing, is the only workstream covered by all ten strategic health authorities. Its contribution to the overall savings total in each region varies from about 1 per cent to 12 per cent.
_________________________________________________________________________________________________________
Figure 9 Example of efficiency savings split by workstreams for four strategic health authorities
Example 1
Example 2
Example 3
Example 4
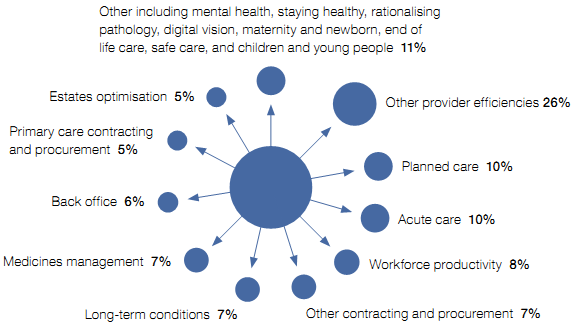
NOTE
1 Workstreams that aim to generate less than 5 per cent of the savings have been grouped together as other.
Source: National Audit Office analysis of strategic health authority integrated plans
_________________________________________________________________________________________________________
3.13 Each workstream is supported by a number of programmes. For example, in one region, the long-term conditions workstream is supported by four programmes (Figure 10). Figure 11 overleaf shows the expected impact of this workstream on an individual primary care trust. As shown in this example, some workstreams will require investment in other parts of the health economy in order to achieve the savings.