Back office operations
1.6 The OEP has estimated approximate expenditure on back office operations of £18 billion per year across the public sector (excluding IT). This figure has been put together using a range of proxies, assumptions and estimates.2 It is the best estimate from the available data, but the actual figure could be as low as £16 billion or as high as £20 billion a year. Chart 1.A
summarises the analysis used to reach the estimate of £18 billion.
Chart 1.A: Summary of estimates for the cost of back office operations across the public sector
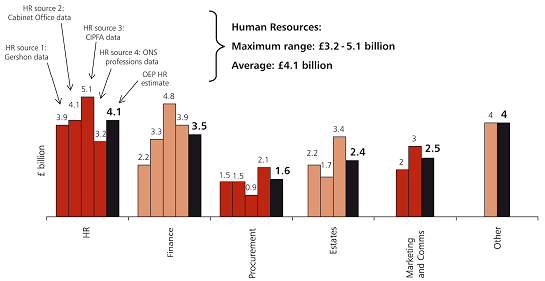
Source: HM Treasury analysis based on a variety of sources, including Gershon data3, Cabinet Office data4, CIPFA data5 and ONS data6
1.7 This workstrand has found wide variations in the efficiency of different public sector organisations. The data that is currently available shows that some organisations in the public sector are already operating at a level equivalent to best practice in the private sector, whereas others achieve far inferior performance. Given the wide spread in the levels of efficiency in back office operations, there is considerable scope for cost savings.
1.8 Three different methodologies have been used to estimate the level of savings achievable:
• benchmarking: This method uses spending distributions on back office operations as a percentage of running costs for a sample of public sector organisations. It identifies the potential savings deliverable from reducing the spend of the poor performers down to various public sector and private sector benchmarks;
• applying private sector cost efficiency experience to the public sector: Uses experience from across the private sector of how costs have been saved from re- engineering and sharing back office operations; and
• public sector best practice: Uses public sector best practice case studies to estimate potential savings.
1.9 Chart 1.B illustrates the benchmarking methodology, using a sample of CIPFA data for around 50-607 public sector organisations. Some organisations will, of course, have particular requirements of their back office functions but the scale of the differences underlines the potential for cost savings. The public sector would only have to move the weakest performing organisations up to the top end of the lowest performance quartile to generate savings of around £4 billion per year.
Chart 1.B: Potential savings using public sector benchmarking methodology and illustrative data
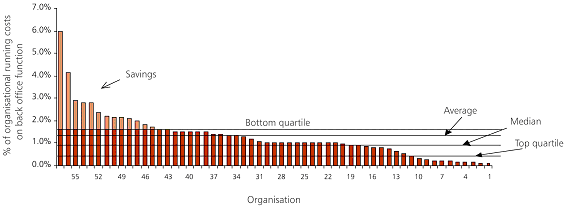
Source: HM Treasury, illustrative data using CIPFA benchmarking data 2006-07
1.10 The potential savings from re-engineering back office operations have also been estimated using extensive research on private sector cost efficiency experience, advisor experience and input from private sector companies with experience in improving back office efficiency. This has shown that 20 to 30 per cent savings can be made from business process re-engineering (BPR) and shared services. BPR has been a common feature of private sector companies for many years, ensuring continuous improvement in the efficiency and effectiveness of an organisation's processes. Some case studies of private sector best practice in making significant savings are summarised in Box 1.A.
| Box 1.A: Private sector case studies A luxury goods manufacturer had unacceptably high operating costs and the survival of the business was consequently under threat. To reduce operating costs, eight European head offices were consolidated into a single location. Finance and HR headcount were both reduced by 70 per cent and complex finance processes were standardised and simplified (e.g. from 6400 line items in the chart of accounts to 640 line items) by implementing a common IT system; A telecommunications firm moved its finance support functions to a central shared service centre located in the UK. The overall goal was to achieve sustainable cost savings across its European business. The result was a reduction in operational costs of between 50 and 66 per cent; and A global distributor developed a shared services model which resulted in cost reductions of between 35 and 40 per cent, greater visibility of its finance and accounting functions across Europe, timely provision of management information and the foundation for further consolidation of its accounting and finance functions. Source: A response to HM Treasury Operational Efficiency Programme: Prospectus, PriceWaterhouseCoopers, October 2008. |
1.11 It is both notable and encouraging that there are a number of best practice examples across the public sector where significant savings have already been made. These public sector case studies demonstrate that savings in the region of 25 to 30 per cent can be made in the cost of back office operations. Some examples are summarised in Box 1.B.
| Box 1.B: Public sector case studies HM Prison Service (HMPS): HMPS have implemented a shared services centre that delivers finance, procurement and HR functions for all 128 Prison Service establishments. It is expected to deliver a 32 per cent saving in staff costs and just over 30 per cent savings against the gross costs of corporate services; National Health Service (NHS): A joint venture, shared business service between the Department of Health and Steria now serves over 100 health trusts. This shared service delivers 20 to 30 per cent savings on like-for-like services; and Department for Work and Pensions (DWP): DWP have set up a shared services organisation providing some HR and finance functions to the Department, its executive agencies and to other parts of government. Savings from shared services of 15 per cent have been achieved already, with further savings of 13 per cent expected for 2008-09. |
1.12 These three different methodologies each indicate that the public sector should be able to achieve a reduction in annual back office costs of around 20 to 25 per cent by the end of the next three years. This is equivalent to a reduction of around £4 billion from the estimated £18 billion annual UK spend on back office operations. The three-year timescale for achieving this reduction is at the upper end of private sector experience for the delivery of cost saving programmes of this kind. Some of the estimated savings will already be underway or planned as part of the current spending review period, but there is considerable scope to go further.
1.13 The programme's recommendations for securing the estimated savings focus on the production and review of top-level performance indicators and the adoption of best practice. The approach centres on transparency rather than micro-management. In summary, government should:
• improve the collection and reporting of data across the public sector. Management information on back office operations should be fully integrated into departmental processes and should be collected and reported on a regular, consistent, auditable and transparent basis to allow for robust comparisons;
• introduce benchmarking and operational performance reviews across the public sector; and
• take the estimated savings into account in determining departmental settlements (taking note of savings already made where appropriate).
1.14 This workstrand sets out a range of case studies and recommendations to public sector organisations highlighting how these estimated savings can be achieved. The full set of recommendations is summarised below.
________________________________________________________________________________________
2 This includes Gershon data, CIPFA data, Cabinet Office data, ONS professions data, departmental returns to the Operational Efficiency Programme and data from a procurement survey. Further information on the OEP back office operations and IT workstrand is available online at www.hm-treasury.gov.uk
3 Unpublished data from the Gershon independent review of public sector efficiency: Releasing resources to the frontline: Independent Review of Public Sector Efficiency, HM Treasury, 2004.
4 Improving corporate functions using shared services, NAO, 2007.
5 Data for 2006-07 from an anonymous sample of public sector bodies, CIPFA, 2008.
6 Civil Service employment by profession, ONS, 2008.
7 The number of organisations submitting their costs varies between function - for example, more organisations submitted finance data than estates management data.