Student attainment
Graph 1 shows attainment in rebuilt schools. Student attainment is expressed in percentage points (pp.) relative to the national average in England. The period shown is three years before and the two years after schools have opened following a rebuild. The data for each school was added to the dataset with reference to the date that teaching in the new facilities commenced. There are 32 conventional and 57 PFI schools in the dataset.
The year immediately prior to opening has been excluded from the analysis. Inclusion of the year prior to opening could distort the findings due to either negative impacts caused by ongoing construction work, or positive motivational effects arising from the imminent opening of a new school building.
Graph 1: Educational attainment in rebuilt schools relative to England average
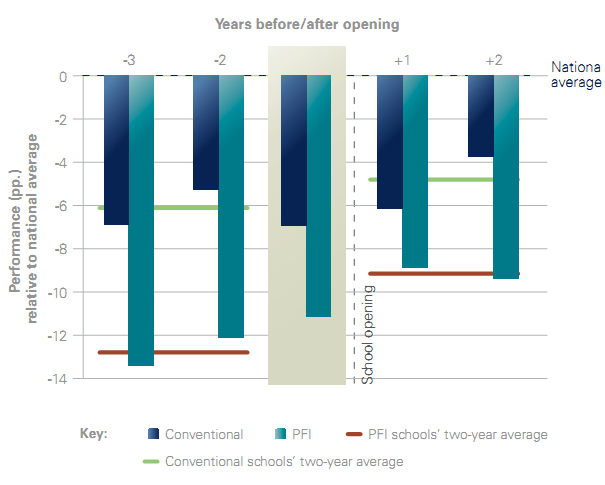
Data sources: UK Department for Children, Schools and Families; Her Majesty's Treasury Analysis: KPMG LLP (UK) 2009

Table 1 is a numerical representation of Graph 1. They both show an upward trend in educational attainment for all rebuilt schools, whether PFI or conventional.
The improvement in the two-year averages can be interpreted to occur over a three-year period. This information is used to arrive at the annual rate of improvement. The average rate of
improvement for all schools in England is 1.54 pp. per annum.
The rate of improvement in student attainment in rebuilt PFI schools (2.75 pp. per annum) is 44 percent higher than that in conventional schools (1.91 pp. per annum).
Table 1
Student attainment relative to national average (pp.) 32 conventional schools | ||||||
|
| Before | After | |||
Year | 3 | 2 | 1 | +1 | +2 | |
Rebuilt schools | -6.89 | -5.27 | -717 | -6.20 | -3.76 | |
Two-year average | -6.08 | excluded | -4.98 | |||
Before v. after improvement | 1.10 |
| ||||
Annual improvement | 0.37 |
| ||||
Annual improvement including national average | 1.91 |
| ||||
Student attainment relative to national average (pp.) 57 PFI schools | ||||||
|
| Before | After | |||
Year | 3 | 2 | 1 | +1 | +2 | |
Rebuilt schools | -13.44 | 12.08 | -10.91 | -8.93 | -9.36 | |
Two-year average | -12.76 | excluded | -9.36 | |||
Before v. after improvement | 3.62 |
| ||||
Annual improvement | 1.21 |
| ||||
Annual improvement including national average | 2.75 |
| ||||