Overall spending reductions in the main 17 departments in 2010-11
2.5 The £6.2 billion of spending reductions announced in May 2010 included some £1.9 billon delegated to the devolved administrations and local government and some £1 billion from specific policy decisions to end programmes, for example, stopping contributions to the Child Trust Fund and ending some elements of employment programmes. The remainder were to be achieved by a range of efficiency and reform measures (Figure 4).
______________________________________________________________________________________________
| Figure 5 Government expenditure and departmental spending 2010‑11 | |||
| 2009-10 real terms (£bn) | 2010-11 (£bn) | Difference (£bn) | |
| Total managed expenditure | 688 | 689 | 0.7 |
| Less: Social security and tax credits | 192 | 194 | |
| Devolved administrations | 58 | 56 | |
| Gross debt interest | 32 | 43 | |
| Locally‑financed spending | 32 | 29 | |
| Other non‑departmental spending (EU, public corporations and lottery) | 18 | 19 | |
| Small departments and security services | 5 | 4 | |
| Other (non‑cash) adjustments | 7 | 8 | |
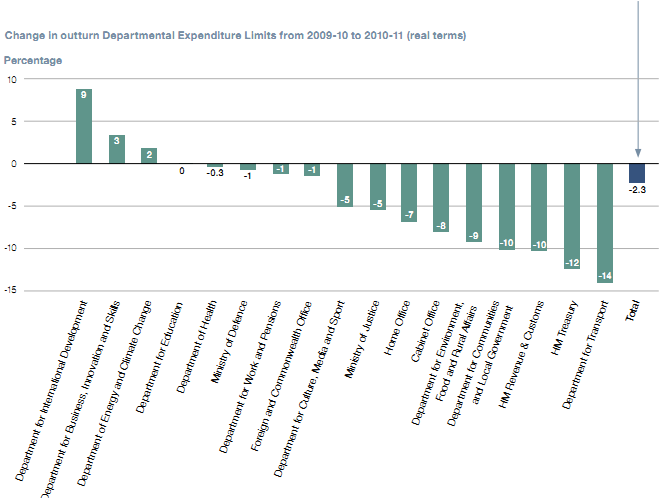
| Resource and Capital Departmental Expenditure Limits for 17 main departments | 344 | 336 | -7. 9 (2.3%) |
NOTE
1 Data on charts will be rounded for simplicity.
Source: National Audit Office analysis of 2011 Budget, Public Expenditure Statistical analysis 2010-11, Public Expenditure Outturn White Papers 2009-10 and 2010 -11, Departmental accounts 2010 -11
______________________________________________________________________________________________
2.6 We tested whether departments had delivered spending reductions by examining the real-terms change in departmental spending from 2009‑10 to 2010‑11 disclosed in departmental accounts. The accounts present spending in terms of:
● administrative costs, which can be split into staff-related expenses and other costs (including, for example, accommodation, IT support and other costs that cannot be directly related to delivering a particular service or output); and
● programme costs, which cover grants and other contractual payments to bodies that directly deliver services or programmes, as well as internal staff accommodation and IT costs that are directly attributable to individual services.
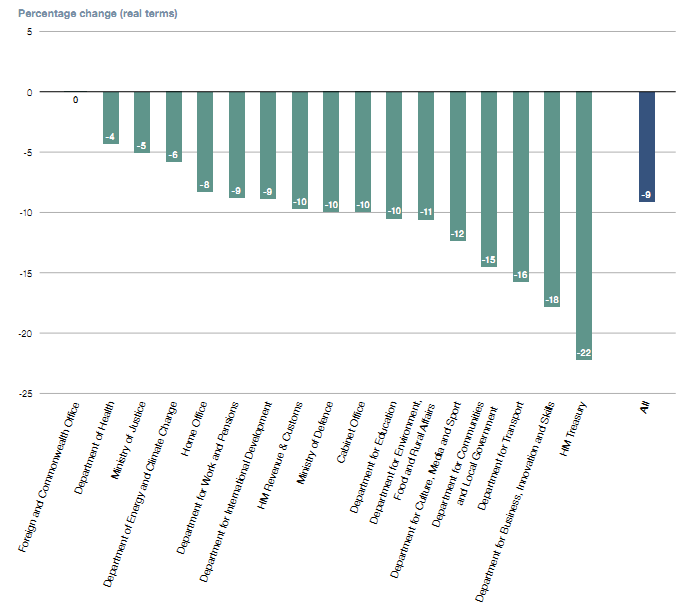
2.7 In order to assess changes in the underlying administration cost base we excluded non-cash items, miscellaneous receipts and one‑off early departure costs of £279 million. Administrative spending fell from £16.8 billion in 2009-10 to £15.3 billion in 2010-11 (a reduction of £1.5 billion or 9 per cent in real terms). The reductions in individual departments (Figure 6 overleaf) varied from a 22 per cent reduction by the Treasury, to a small increase in the Foreign and Commonwealth Office.5
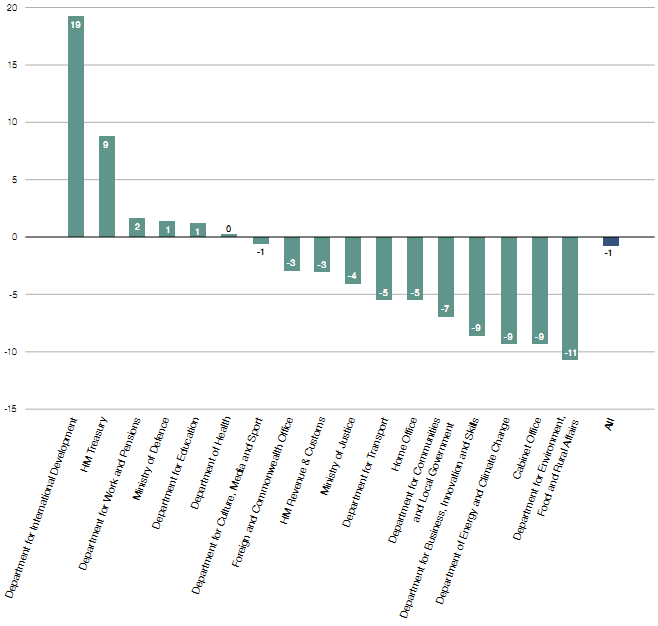
2.8 Programme spending covers direct spending on front‑line services including grants to third parties. It includes items covered by controls on Departmental Expenditure Limits and Annually Managed Expenditure (Figure 1). Again, excluding non-cash items, receipts and early departure costs of £367 million, overall programme spending fell by £3.4 billion (1 per cent) in real terms. There are significant variations between individual departments (see Figures 7 on page 21 and Figure 8 on page 22) including:
● real‑terms increases in spending on international aid (£1.1 billion), education (£691 million) and health (£187 million), reflecting the priorities announced by the Government;
● a £2.4 billion increase in welfare payments reflecting the impact of the economic downturn and demographic changes; and
● substantial reductions in grants by the Department for Communities and Local Government, including £2.2 billion to local authorities.
2.9 Some of these changes are movements in Annually Managed Expenditure (Figure 1) and do not contribute to the reduction in Departmental Expenditure Limits discussed in paragraph 2.3 They are shown here for completeness and to maintain consistency with departmental accounts. The fall in programme spend within Departmental Expenditure Limits is approximately £5 billion.6
| Figure 6 Real-terms change in administrative spending 2009-1 0 to 2010 -11 by department Percentage change (real terms)
NOTES 1 The analysis excludes income, non-cash items and adjusts for the costs of early departures to give a better view of the underlying cost reductions. 2 The Ministry of Justice's figure excludes spending by the devolved administrations. 3 Data on charts will be rounded for simplicity. Source: National Audit Office analysis of departmental accounts 2010-11 |
| Figure 7 Real-terms change in programme spending by departments 2009-10 to 2010-11 Percentage change (real terms)
NOTES 1 The analysis excludes income, non-cash items and adjusts for the costs of early departures to give a better view of the underlying cost reductions. 2 The Ministry of Justice's figure excludes spending by the devolved administrations. 3 Data on charts will be rounded for simplicity. Source: National Audit Office analysis of departmental accounts 2010-11
|
| Figure 8 Analysis of real‑terms variations in programme spend 2009‑10 to 2010‑11 | |||||
| Department | Reduction (£m) | Increase (£m) | Real-terms change in spending (%) | Explanation for changes | |
| Department for Work and Pensions | 2,4 41 | 2 | Impact of economic downturn | ||
| Department for International Development | 1,082 | 19 | Government target to increase aid to 0.7 per cent of GDP from 2013 | ||
| Department for Education | 691 | 1 | Increased funding for children from poor backgrounds | ||
| Ministry of Defence | 376 | 1 | Net effect of large number of savings and additional costs, e.g. equipment support and fuel costs | ||
| Department of Health | 187 | <1 | Government held to existing health spending plans for 2010‑11 | ||
| HM Treasury | 5 | 9 | Increase in coinage costs | ||
| Department for Culture, Media and Sport | 34 | ‑1 | Mainly reduced expenditure by the BBC | ||
| Cabinet Office | 39 | ‑9 | Mainly reductions in grants paid by Office for Civil Society | ||
| Foreign and Commonwealth Office | 62 | ‑3 | Reductions in front‑line staffing and other support costs | ||
| Ministry of Justice | 381 | ‑4 | Mainly reductions in grants and savings on accommodation | ||
| Department for Energy and Climate Change | 389 | ‑9 | Mainly reduction in grants to nuclear decommissioning authority to offset higher commercial income | ||
| HM Revenue & Customs | 396 | ‑3 | Mainly savings in child benefit payments | ||
| Home Office | 643 | ‑5 | Reductions in police grant and significant reductions in IT, estates and consultancy spending | ||
| Department for Environment, Food and Rural Affairs | 671 | ‑11 | Mainly reduced grants and rural payments | ||
| Department for Transport | 706 | ‑5 | Reductions in arm's‑length bodies, reduced road maintenance and less support for passenger rail services. However, local authority road grants increased by £171 million | ||
| Department for Business, Innovation and Skills | 2,046 | ‑9 | Impact of higher fees in higher education and closure of regional development agencies | ||
| Department for Communities and Local Government | 2,788 | ‑7 | Reductions in grant to local authorities and other delivery partners | ||
| Total | 8 ,155 | 4,781 | 1 | ||
| Net total | ‑3,374 | ||||
| NOTE 1 The analysis excludes income, non-cash items and adjusts for the costs of early departures to give a better view of the underlying cost reductions. 2 The Ministry of Justice's figure excludes spending by the devolved administrations. Source: National Audit Office analysis of departmental accounts | |||||
________________________________________________________________________________________________________________
5 These changes include changes in the definition of administrative costs which could not always be fully reflected in prior year figures.
6 The remainder of the total £7.9 billion reduction in Departmental Expenditure Limits is accounted for by capital expenditure (paragraphs 2.10 to 2.13), and movements in early departure costs (paragraphs 2.17 to 2.19, and non-cash items and provisions (paragraph 2.3) for which year-by-year comparison is not meaningful.