Current spending on infrastructure is well below this US$3 trillion threshold, even when considering fiscal stimulus
Just as it is challenging to estimate the investment need globally, it is challenging to establish what is actually being spent. Table 2 shows current infrastructure spending levels in a range of countries, primarily emerging economies, and provides a sense of how much infrastructure investment will need to increase in order to meet the notional 5 percent of GDP target.
Figure 2: Average annual worldwide infrastructure expenditure forecasts
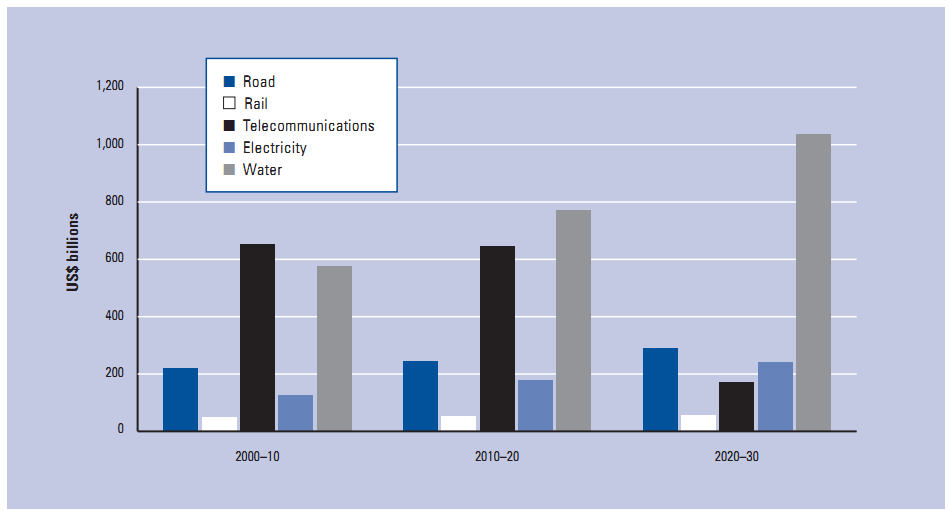
Source: Based on OECD data from OECD (2006), Infrastructure to 2030: Telecom, Land Transport, Water and Electricity, p. 29.
Table 2: Current infrastructure spending levels in selected countries
Country | Amount | Period | Percent GDP* |
Argentina | 20.7 | 2009-March 2010 | 3.7 |
Brazil | 212.6 | 2007-March 2010 | 3.5 |
Indonesia | 9.2 | 2009-March 2010 | 0.9 |
Malaysia | 2.0 | 2009-March 2010 | 0.5 |
Mexico | 200.0 | 2008-13 | 2.7 |
South Africa | 60.0 | 2009-11 | 4.1 |
Source: Foreign Affairs and International Trade Canada, 2009.
Note: Information about budgetary provisions for infrastructure has been
adjusted to give an annualized number.
* Annualized GDP number.
Although the headlines might lead to the conclusion that the fiscal stimulus amounts to a transformational quantity of additional expenditure, analysis undertaken by the International Monetary Fund (IMF) indicates that the additional budget funding allocated to infrastructure projects in the two-year period of 2009-10 remains a small percentage of GDP. In many countries, the fiscal stimulus provides an additional allocation for only one year. This is illustrated in Figure 3.