Fiscal consolidation
1.57 As set out in Table 1.4, the Government plans a total consolidation of £147 billion per year by 2016-17, consisting of total reductions in spending of £116 billion and a net increase in taxes of £31 billion. Implementation of these plans is well underway with all of the tax consolidation measures legislated following Finance Act 2011. Spending Review 2010 implementation is on track. Many of the major structural reforms required to deliver savings while protecting priority public service outcomes are already underway, including reforms to higher education, housing and welfare.
1.58 Taking the consolidation as a whole, 72 per cent of the total consolidation will be delivered by lower spending in 2014-15, rising to 79 per cent in 2016-17. This is consistent with OECD and IMF research, which suggests that fiscal consolidation efforts that are skewed to spending cuts are more likely to be successful.19
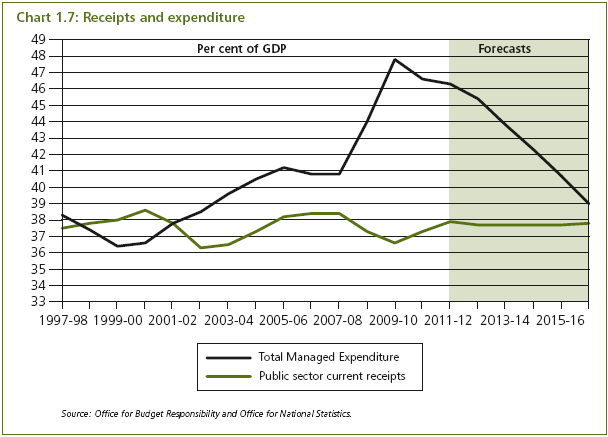
1.59 Chart 1.7 shows that as a result of the plans set out in the Autumn Statement, public spending is projected by the OBR to fall from around 48 per cent of GDP in 2009-10 to 39 per cent of GDP by 2016-17, around the same level as 2003-04. Public sector current receipts are projected to rise from around 36½ per cent of GDP to around 38 per cent of GDP by 2016-17.
Table 1.4: Total consolidation plans over the forecast period
| £ billion | |||||
| 2011-12 | 2012-13 | 2013-14 | 2014-15 | 2015-16 | 2016-17 |
Policy inherited by the Government | 26 | 40 | 56 | 70 |
|
|
Spending1 | 14 | 24 | 37 | 49 |
|
|
Tax | 12 | 16 | 19 | 21 |
|
|
Spending share of consolidation (per cent) | 54 | 60 | 66 | 70 |
|
|
Total discretionary consolidation | 42 | 60 | 85 | 107 | 130 | 147 |
Spending1,2,3 | 22 | 37 | 56 | 77 | 100 | 116 |
Tax2 | 20 | 23 | 29 | 30 | 30 | 31 |
Spending share of consolidation (per cent) | 53 | 62 | 66 | 72 | 77 | 79 |
1 Spending consolidation is attributable to three factors: (a) reductions in DEL are calculated by assessing nominal DEL totals against a counterfactual of growing DELs from 2010-11 in line with general inflation in the economy, as set out in Table 4.8 of the OBR's pre-Budget forecast (June 2010); (b) reductions in welfare AME due to the net effect of policy changes announced since June Budget 2010; (c) estimated debt interest savings, updated for market interest rates consistent with the OBR's November 2011 Economic and fiscal outlook. The fall in market interest rates, since Budget 2011, as used by the OBR, reduces the nominal totals for spending consolidation. 2 Tax and welfare AME measures as costed previously. For outer years that have now come into the forecast period, the impacts of tax and welfare AME measures announced previously are grown in line with general inflation in the economy. 3 The Government has not set DELs for 2015-16 and 2016-17. Figures shown above are based on plans for public spending beyond the Spending Review 2010 period as set out in Table 2.2. Source: Office for Budget Responsibility and HM Treasury. | ||||||
_________________________________________________________________________________
19 See Economic Outlook, OECD, June 2007, OECD Economic Survey: United Kingdom 2011, OECD, March 2011 and UK Article IV Consultation, IMF, May 2009.