4. Trends
With a time series of four consecutive surveys now available, some discernable trends can be established
Figure 12 details the infrastructure needs from 1999 to 2006, showing an increase of 55%, from approximately $9 billion to $20 billion over this time frame.
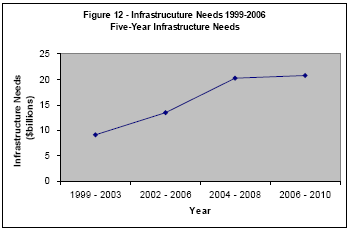
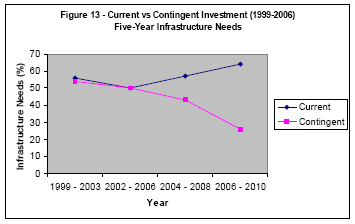
Figure 13 portrays the trends of investments possible under existing funding programs versus those contingent on new external investment. Current and contingent investments each represented about half of the total in 1999 and 2002.
More recently, the share of investments contingent on new external funding has dropped significantly, which appears to be a result of increasing federal and provincial government support, including the ability for transit systems to plan on the strength of promised transfer of funds from the federal gas tax.
It is important to note that many transit infrastructure projects are long range in nature and as funding arrangements become more available, transit systems will tend to count on them to plan for future replacement or expansion needs.
If transit infrastructure investment from the federal and provincial governments grows to meet the full needs and is maintained in the long term, it is conceivable that the current plateau could remain stable, with replacement needs declining as a proportion of the total, thereby making way for further expansion and capacity building.