Airport capacity
3.30 The Government forecasts that the number of air passengers using UK airports will recover from the recent downturn, rising from 211 million passengers per annum (mppa) in 2010 to 335mppa (within the range 300mppa to 380 mppa) in 2030 and to 470mppa (within the range 380mppa to 515 mppa) in 2050. These forecasts imply average annual growth in passenger numbers of 2.0 per cent (within the range 1.5-2.3 per cent) to 2050, significantly lower than the 3.7 per cent average seen over the past twenty years.
3.31 These forecasts are based on the assumption that there will be no new runways in the UK, with only incremental developments to airport terminals to make maximum use of existing runways. If airport capacity were unconstrained, passenger demand would probably be three per cent higher than constrained demand (maximum use of existing capacity within current planning constraints) by 2030 (see Tables 3.A and 3.B), and 11 per cent higher by 2050. These forecasts suggest that, without new runways, the three largest London airports will be at
3.30 capacity in 2030 and that in the longer term there will be an airport capacity challenge in the south-east of England.
Table 3.A: Constrained and unconstrained aviation forecasts (passengers)
Airport | 2010 Actual passengersa | 2030 Unconstrainedb |
With maximum use of current capacityb |
Heathrow | 66 | 117 | 85 |
Gatwick | 31 | 43 | 39 |
Stansted | 19 | 25 | 34 |
Luton | 9 | 12 | 17 |
London City | 3 | 7 | 7 |
London Total | 127 | 205 | 182 |
Regions Total | 83 | 138 | 152 |
UK | 211 | 343 | 334 |
Source: | |||
Airport | 2010 Actual Air Transport Movementsa (thousands) | 2030 Unconstrainedb |
With maximum use of current capacityb |
Heathrow | 450 | 718 | 480 |
Gatwick | 241 | 294 | 260 |
Stansted | 145 | 198 | 259 |
Luton | 73 | 106 | 132 |
London City | 67 | 135 | 120 |
London Total | 975 | 1,451 | 1,251 |
Regions Total | 1,209 | 1,541 | 1,673 |
UK | 2,184 | 2,992 | 2,924 |
Source: | |||
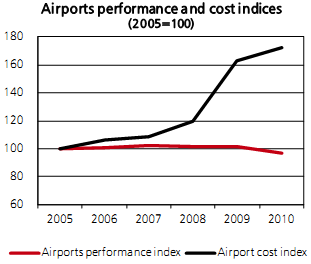
Chart 3.C: Airport performance and cost details and comparative performance | |
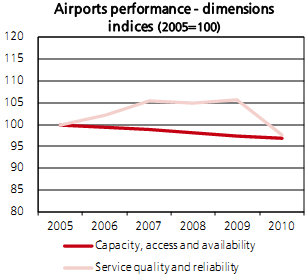
Source: For more details on methods, definitions and sources used in the construction of the indices, see Annex D |
Source: For more details on methods, definitions and sources used in the construction of the indices, see Annex D |
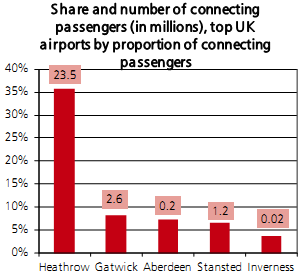
Sources: CAA, Department for Transport |
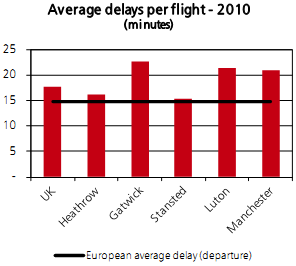
Sources: CAA, Eurocontrol |
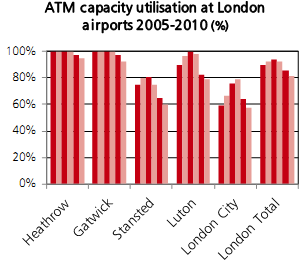
Sources: CAA |
Sources: CAA |