Container ports supply chain
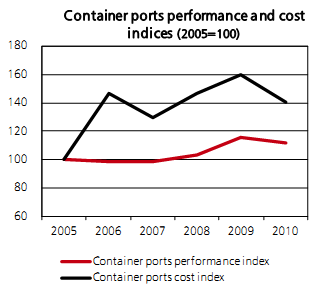
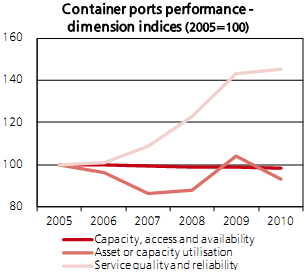
3.32 Performance of the supply chain through UK container ports has improved since 2005, largely driven by improved service quality (reduced delivery times and improved connectivity). On the other hand, the cost of importing and exporting goods via container ports has increased, although this is partly as a result of other cost elements (e.g. inland transport, administrative fees, documents, but not taxes and tariffs) which do not relate to port infrastructure.
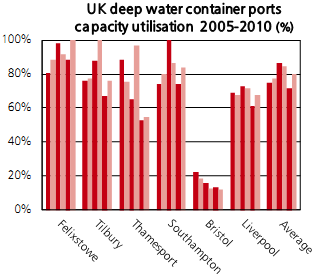
3.33 The recent recession freed up some spare capacity at deep water ports in 2009, but demand began to recover in 2010, with Felixstowe operating close to estimated capacity (see Chart 3.D). The on-going development of Felixstowe South should ease this situation.
3.34 Despite these challenges:
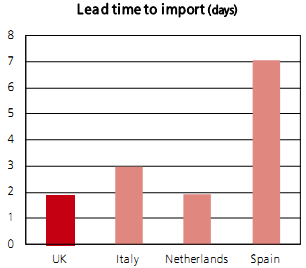
• The UK has some of the lowest lead time to import in Europe, a measure that includes dwell times at ports;
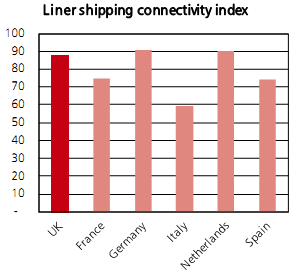
• The UK has some of the best connected ports in Europe, as measured by the liner shipping connectivity index; and
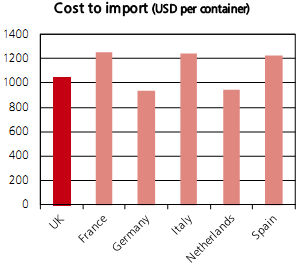
• In spite of the recent increases in the cost to import a shipped container, the UK still offers a competitive environment when compared to other European countries.
Chart 3.D: Container ports supply chain performance and cost details and comparative performance | |
Source: For more details on methods, definitions and sources used in the construction of the indices, see Annex D |
Source: For more details on methods, definitions and sources used in the construction of the indices, see Annex D |
Sources: Department for Transport, Drewry Maritime Research, MDS Transmodal |
Sources: World Bank |
Sources: UNCTAD |
Sources: World Bank |