Electricity
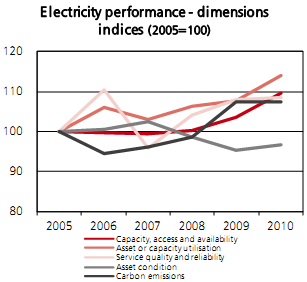
3.62 The performance of the UK's electricity sector has improved since 2005 on the set of measures displayed below, with all indicators of performance (except asset condition) showing a positive trend (see Chart 3.E). The UK has one of the most reliable electricity transmission networks in the world, with 99.9999 per cent system reliability and very low levels of unplanned energy interruptions.7
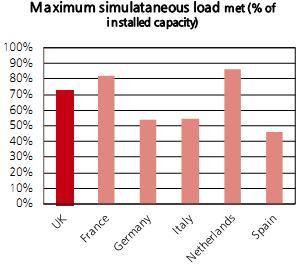
3.63 At the moment capacity margins in electricity generation are adequate relative to peak demand (to some extent, driven also by a fall in peak demand due to the recession). Chart 3.E below indicates that the UK has larger capacity margins compared to countries such as France and the Netherlands, but lower than Germany, Italy or Spain. A higher margin is not, however, in itself a sufficient indicator of security of supply: what is considered adequate in a country with a large proportion of intermittent supply such as Spain can be very different from what is needed in countries with largely reliable generation like France. The UK therefore needs to assess its own capacity needs based on its evolving generation mix over time.
| Chart 3.E: Electricity performance and cost – details and comparative performance | |
|
Source: For more details on methods, definitions and sources used in the construction of the indices, see Annex D |
Source: For more details on methods, definitions and sources used in the construction of the indices, see Annex D |
|
Sources: Department of Energy and Climate Change, ENTSO-E |
Sources: EEA, OECD, Department of Energy and Climate Change |
|
Source: Department of Energy and Climate Change Quarterly energy prices tables |
Source: Department of Energy and Climate Change Quarterly energy prices tables |
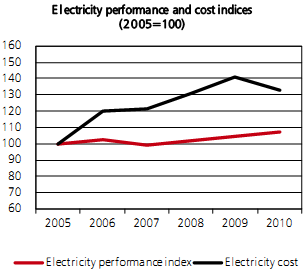
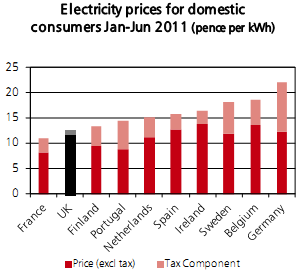
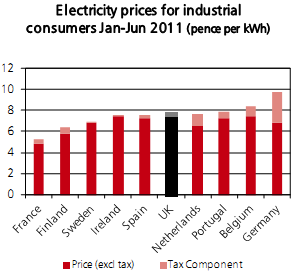
3.64 The cost of electricity has increased over time, reflecting both higher wholesale prices for gas and electricity as well as higher expenditure on transmission and distribution network infrastructure. UK electricity prices including taxes are among the lowest in Europe for domestic customers and are near the median for medium and large industrial consumers. Differences in costs across Europe are caused by a range of factors including variations in generation mix and tax treatment. Electricity costs for very large industrial users relative to the rest of EU are less certain and are particularly influenced by exemptions from policy costs in different countries.
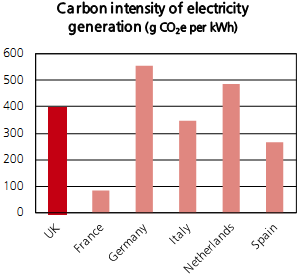
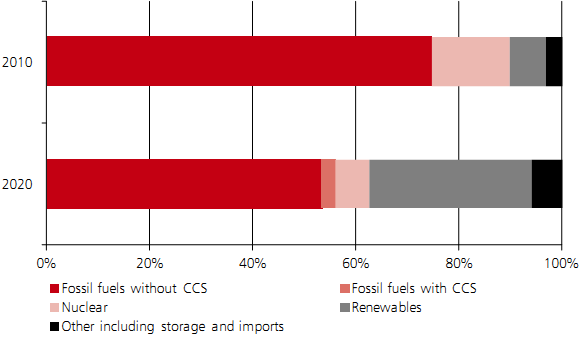
3.65 The carbon intensity of the UK's electricity generation is above the average for comparable European economies (see Chart 3.E). The UK however has ambitious goals to reduce the carbon intensity of its economy, and the generation mix of the electricity system is likely to shift towards lower carbon sources over the next two decades (see Chart 3.F below).
| Chart 3.F: Projected electricity generation mix (by source of fuel)
Source: Updated Energy and Emissions Projections Annex E (Total Generation by Source), Central scenario, DECC (2011). This reflects assumptions on fossil fuel and carbon prices. Timescales for the deployment of new nuclear capacity in the UK will be the result of commercial decisions made by private investors and will be affected by the government’s proposals for reform of the electricity market which are not taken into account in these projections. Developers have announced plans to build 16GW of new nuclear capacity in the UK, with the first reactor scheduled to become operational in 2019 |
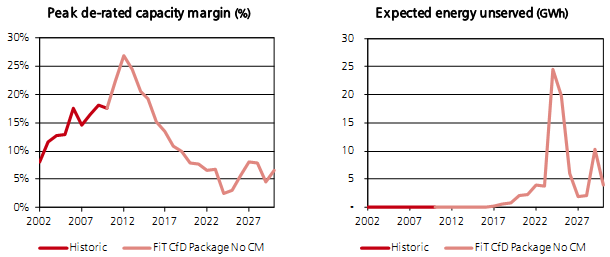
3.66 Around a fifth of the UK's electricity generation capacity (roughly 20GW) will close over the next decade. Much of this will be replaced with intermittent sources of generation. Without further action, modelling indicates that spare capacity margins may fall below five per cent around the end of this decade, which would increase the risk of power cuts as a result of insufficient capacity (see Chart 3.G).8
| Chart 3.G: Modelling of peak de-rated capacity margin and expected energy unserved (gigawatt hours)
Source: Department of Energy and Climate Change, July (2011). The de-rated capacity margin is the capacity margin adjusted to take account of the availability of plant, specific to each technology. It reflects the probable proportion of a source of electricity that is likely to be technically available to generate. The chart above presents the results of modelling the electricity system in the absence of a capacity mechanism, but with increased low carbon generation induced by the support mechanisms presented in the White Paper on Electricity Market Reform. |
_________________________________________________________________
7 Measured in terms of the proportion of energy needs that the system fails to meet.
8 Installed capacity at the end of 2010 has increased to 90.2 GW from 84.7GW at the end of 2009, which is why this figure differs from the 'quarter' quoted in the July Electricity Market Reform White Paper. Around 19.1GW (21 per cent of installed capacity) is expected to close by 2020 as a result of EU regulations and nuclear plant coming to the end of its regulated life.