Natural gas
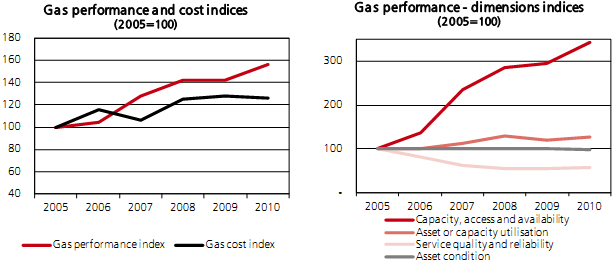
3.67 The performance of the UK's gas sector has improved since 2005, outpacing the increase in costs (see Chart 3.H). Performance has been driven by an increase in import and storage capacities, to adapt to a reduction in domestic production. Service quality and reliability has dipped recently, due to more frequent (planned) interruptions in supply arising from a large gas mains renewal programme. Unplanned interruptions have decreased over time.
Chart 3.H: Gas performance and cost trends 2005-2010
Source: For more details on methods, definitions and sources used in the construction of the indices, see Annex D. |
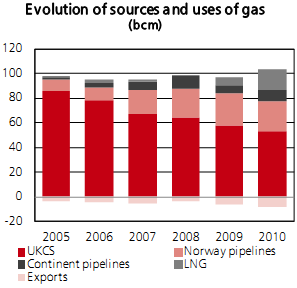
3.68 Chart 3.I shows other notable aspects of the gas system. In particular:
• although gas consumption has remained largely constant since 2005, the proportion serviced by imports has more than quadrupled. Consequently, significant gas import capacity has come on stream in the form of new or expanded import pipelines (from Norway, Belgium and the Netherlands) and liquefied natural gas (LNG) terminals which deliver gas from global markets;
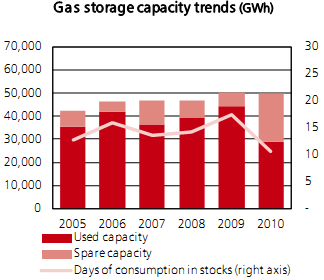
• gas storage capacity has also increased, but the volume of gas actually stored decreased in 2010, before rising to the highest recorded levels for the start of winter 2011. Annual changes reflect both the changes to available capacity, and the commercial demand for that capacity, e.g. due to expectations of future price differentials between summer and winter; and
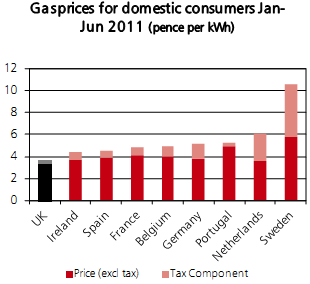
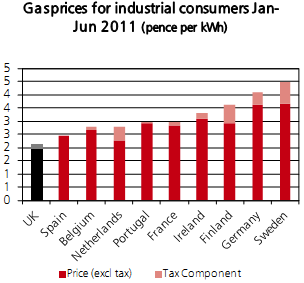
• UK gas prices (including taxes) for most users are among the lowest compared with other major EU countries.
Chart 3.I: Gas performance and cost - details and comparative performance | |
Source: National Grid |
Source: National Grid, Department of Energy and Climate Change |
Source: Department of Energy and Climate Change Quarterly energy prices tables Notes: Prices are for "medium consumers". France and Spain data are for the period Jul - Dec 2010 |
Source: Department of Energy and Climate Change Quarterly energy prices tables Notes: Prices are for "medium consumers". France and Spain data are for the period Jul - Dec 2010 |