Current position and challenges
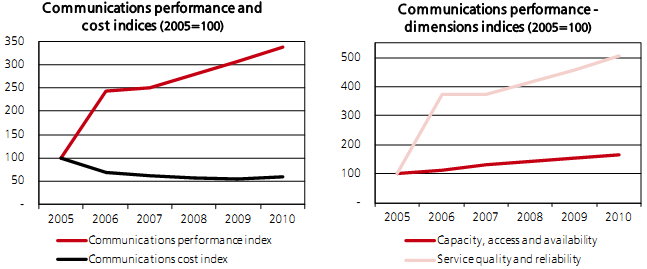
3.93 The UK's communications networks have seen significant improvements in performance - taking account of speeds, uptake and capacity or fixed telecoms, mobile and broadband services - since 2005. Increases in broadband download speeds are to a large extent responsible for the measured improvement in service quality. Communications costs have substantially decreased over the same period (see Chart 3.K). This is consistent with the fact that the UK has a thriving, competitive environment in which to meet the needs of the majority of the population.
Chart 3.K: Communications performance and cost trends 2005-2010
Source: For more details on methods, definitions and sources used in the construction of the indices, see Annex D. |
3.94 In its first communications report, Ofcom has defined a number of key metrics to provide simple proxies for the state of the UK communications networks and services.11 This information is currently only available for 2011, but Ofcom will track it in future reports to build up an assessment of the evolution of UK communications networks. The table below presents a summary of these key metrics, which complement the indicators tracking historical performance contained in the Government analysis above.
Table 3.D: Ofcom's communications infrastructure dashboard 2011
| Network performance |
|
| Fixed telephony | Performance in 2011 |
| Coverage of fixed line telephony | 100 per cent of premises |
| Fixed broadband |
|
| Coverage of broadband at 2 megabits per second or more | 86 per cent of existing connections |
| Coverage of Superfast broadband (24 megabits per second or more) | 58 per cent of premises |
| Average fixed broadband modem sync speed (March 2011) | 7.5 megabits per second |
| Mobile 2G (outdoor) |
|
| Premises served by all operators | 97 per cent of premises |
| Premises not served by any operator | less than 0.1 per cent of premises |
| Geographic area coverage by all operators | 66 per cent of land area |
| Geographic area not served by any operator | 6 per cent of land area |
| Mobile 3G (outdoor) |
|
| Premises served by all operators | 73 per cent of premises |
| Premises not served by any operator | 1 per cent of premises |
| Geographic area coverage by all operators | 13 per cent of land area |
| Geographic area not served by any operator | 30 per cent of land area |
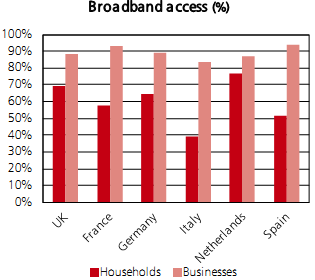
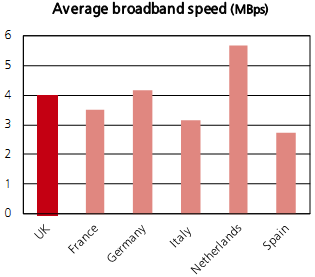
3.95 In comparison with some OECD countries (see Chart 3.L):
• household broadband penetration in the UK is one of the highest in Europe. Business broadband penetration, whilst high, is slightly below the levels of other comparable European countries; and
• download speeds in the UK are in the top tier among comparable European countries.
3.96 Ofcom research using 2009 data found that:
• the UK had above average mobile coverage and relatively strong take up of mobile connections, compared to groups of 12 and 16 developed and leading emerging economies respectively; and
• the UK had lower than average fixed voice call costs but relatively high mobile voice call costs, compared to groups of 14 and 16 countries respectively.12
| Chart 3.L: Communications performance and cost - comparative performance | |
|
|
|
| Source: OECD Note: 2009 data | Source: OECD Note: 2010 data - not in line with current estimates for UK |
3.97 Overall, the communications market in the UK has been successful, for instance in delivering broadband at good speeds to a wide section of the population and accommodating high take-up of mobile communications services. But there are some areas where the market alone cannot deliver. Measuring average performance can conceal variations in performance across the country. Ofcom has also produced a 'fixed broadband map' which tracks a number of metrics including average broadband take-up, the percentage of population receiving less than two megabits per second, superfast broadband availability and average modem sync speed (see Figure 3.C, which also depicts Broadband Delivery UK investment and BT's fibre-optic roll out plans).
| Figure 3.C: Overall performance of fixed line broadband across the UK, Broadband Delivery UK investment and BT fibre optic roll out
Source: Ofcom (July 2011), Broadband Delivery UK, BT |
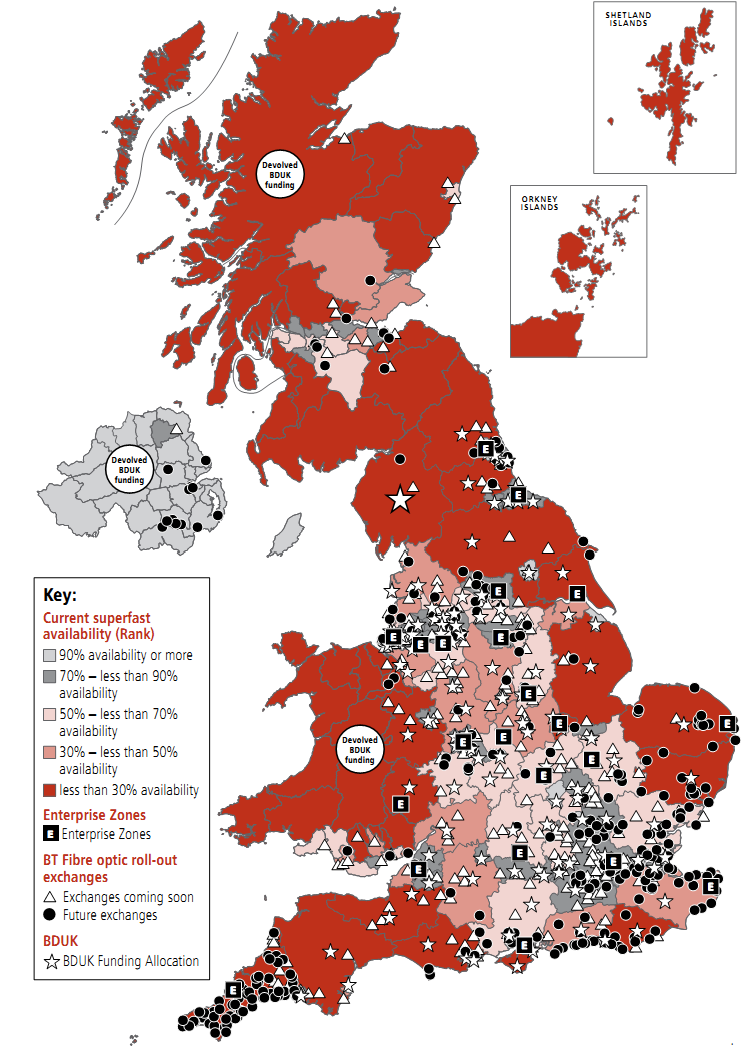
3.98 The current regional performance looks particularly weak as far as coverage of superfast broadband is concerned, with overall availability of superfast broadband restricted to 58 per cent of the UK's population, and very large regional variations. For instance, 97 per cent of Northern Ireland's population has access to superfast broadband, but only 30 to 40 per cent of Wales and Scotland do.
3.99 Looking forward, developments in the sector may put existing infrastructure under strain without further action:
• spectrum capacity may struggle to accommodate further development of the communications industry without technological solutions that support more efficient use of existing spectrum;
• eventually the limit of the data rates that can be extracted from existing fixed-line networks will be reached. Developments in Information Technology, for instance cloud computing, may place increased demands on the networks' use, potentially crowding out some users and uses;
• the Government and regulator will also need to consider changing patterns of TV and radio content consumption for instance with greater moves towards Internet Protocol television use; and
• widespread use of smart meters can be accommodated within the current digital communication network infrastructure, but potential future developments of smart energy grids might require further innovation and investment in communications infrastructure.
_________________________________________________________________________
11 Infrastructure Report, Ofcom, 2011
12 International Communications Market Report 2010, Ofcom, December 2010