Caveats on interpretation
D.6 Although every care was taken in developing a meaningful set of performance and cost indicators, in collaboration with Departments and regulators, this type of exercise is not without its challenges:
• Aggregation and explicit weightings: in order to summarise all the information contained in the different indicators, composite indicators can use different aggregation formulas (e.g. arithmetic average, geometric average) which can make an explicit use of weightings in order to reflect the relative importance of the different components. In the absence of any reliable data to determine the relative importance of the different dimensions used in the analysis for this plan, information was aggregated using simple, unweighted averages.
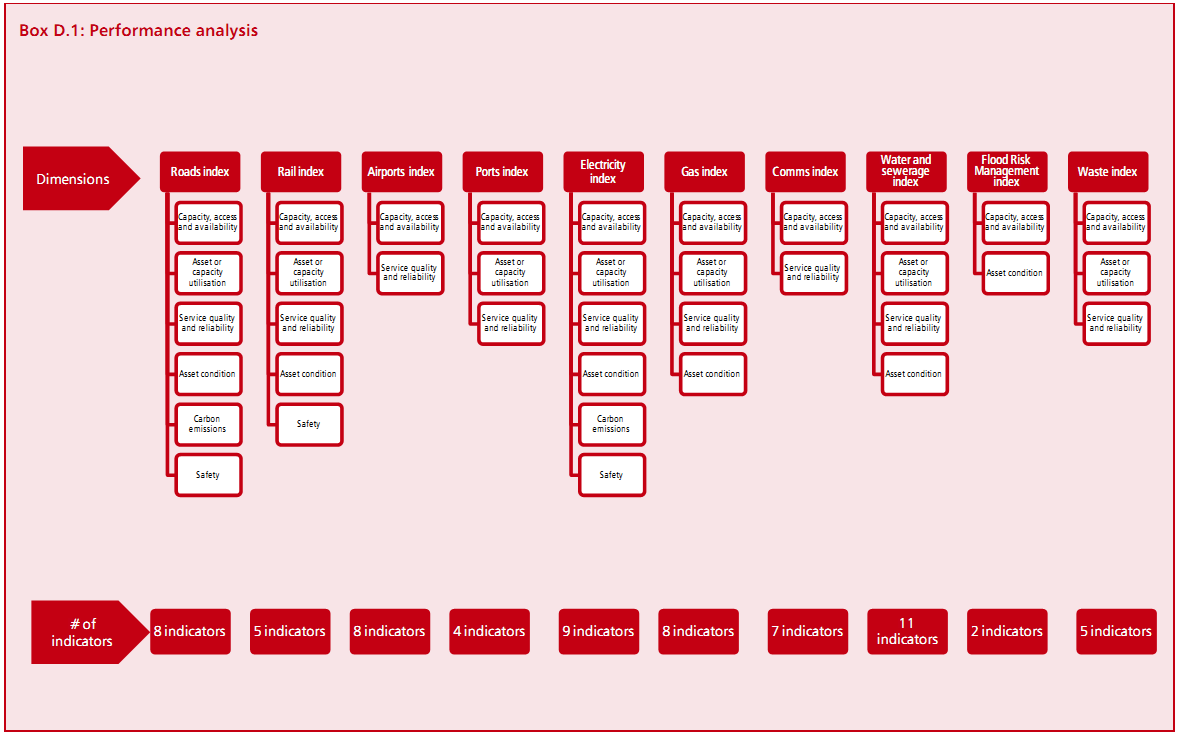
• Implicit weightings: even when no explicit weightings are used, the actual choice of indicators and dimensions will have an impact on the composite indicator. This plan uses a consistent set of dimensions across all 10 sectors, which is designed to reflect all major dimensions of performance. In total, data have been used from 67 performance indicators and 20 cost indicators. It is possible, however, that more data will become available in the future and it will be necessary to weigh the benefits of incorporating this new data against the benefits of maintaining comparable time series data.
• Robustness: a particular indicator can have a big influence on the composite indicator when only a limited number of indicators are available. In these situations, a single indicator showing a dramatic evolution can mask the underlying evolution of other indicators showing a less spectacular evolution. This issue has been dealt with by attempting to incorporate a wide array of relevant indicator for each dimension.
• The choice of base year: the analysis in this plan shows the evolution of performance in relation to performance at a given point in the past. Therefore, the choice of the base year is important. The historical availability of data differs for different indicators, so there is a trade-off between obtaining long data series and keeping a reasonable amount of indicators to minimise the problems highlighted above. In addition, it should be noted that indices showing the evolution of an indicator over time can be very sensitive to the underlying indicator having a very low initial base. As noted above, 2005 is the earliest year for which consistent time series data were available across the sectors.