Simplified Example
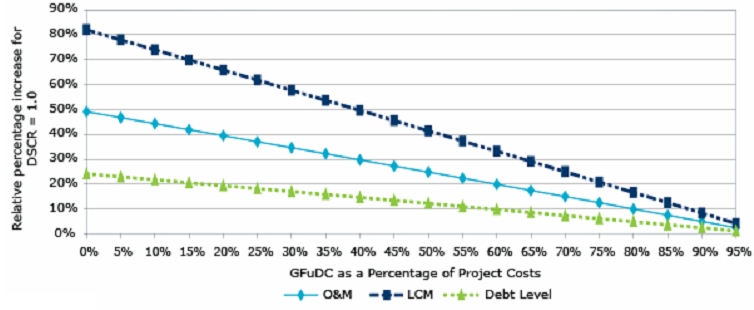
To illustrate the inverse relationship between GFuDC and a project's ability to withstand financial shocks during operations, consider a hypothetical availability-based PPP project with a total cost of $540 million and three substantial completion payment options of 0%, 25% and 50%. The project has a 30-month construction period and debt in the permanent capital structure will fully amortize over a 30-year operating phase and bear a 7% coupon. Under each option, payments from the government are sculpted achieve a minimum and average DSCR of 1.20 times throughout the operating period, and the output specifications for the operating phase are the same, resulting in identical O&M and Lifecycle expense profiles. Other details are contained in figure 1, with amounts representative of one year of a project in its last ten years of operations. While under each option the gearing is 90:10 and the DSCR is 1.2 times, the O&M Cost Breakeven, Lifecycle Cost Breakeven and Additional Indebtedness Breakeven ratios become progressively weaker as the substantial completion payment increases, as smaller debt scenarios require smaller debt service payments for every basis point of DSCR (roughly $0.4 million per basis point in option 1, trending to approximately $0.2 million per basis point in option 3). Figure 2 graphically represents this relationship for a generic PPP project. | Figure 1 (amounts $millions) | Option 1 | Option 2 | Option 3 | |
Substantial Completion Payment | 0% | 25% | 50% | ||
Project Cost (Construction & SPV) | $ 450.0 | $ 450.0 | $ 450.0 | ||
Interest During Construction | $ 84.1 | $ 86.9 | $ 89.7 | ||
Permanent Gearing 90% 90% | 90% | 90% | 90% | ||
Debt in Permanent Capital Structure | $ 480.7 | $ 362.4 | $ 242.9 | ||
Revenue |
|
|
| ||
Capital Revenue | $ 46.5 | $ 35.0 | $ 23.5 | ||
O&M Revenues | 15.8 | 15.8 | 15.8 | ||
Life Cycle Revenues | 9.5 | 9.5 | 9.5 | ||
Total Revenue |
| $ 71.7 | $ 60.3 | $ 48.7 | |
Expenses |
|
|
| ||
O&M Costs | $ 15.8 | $ 15.8 | $ 15.8 | ||
Life Cycle Costs | 9.5 | 9.5 | 9.5 | ||
Total Operating Expenses |
| $ 25.2 | $ 25.2 | $ 25.2 | |
CFADS | $ 46.5 | $ 35.0 | $ 23.5 | ||
Debt Service | $ 38.7 | $ 29.2 | $ 19.6 | ||
1.20x | 1.20x | 1.20x | |||
Cash Cushion | $ 7.7 | $ 5.8 | $ 3.9 | ||
O&M Cost Breakeven | 49.1% | 37.0% | 24.8% | ||
Life Cycle Cost Breakeven | 81.9% | 61.8% | 41.4% | ||
24.2% | 18.2% | 12.2% | |||
Figure 2: Project Resilience as a Function of Government Funding Levels for a Generic PPP Project
Source: DBRS.
While substantial completion payments have been used for the purposes of this example, the relationship holds when the GFuDC takes the form of milestone payments. DBRS notes that the inverse relationship occurs when considering a project's resilience during operations versus the amount of debt relative to GFuDC, and not as a function of the absolute debt level.