Projects approved over the past decade have shown lower cost growth
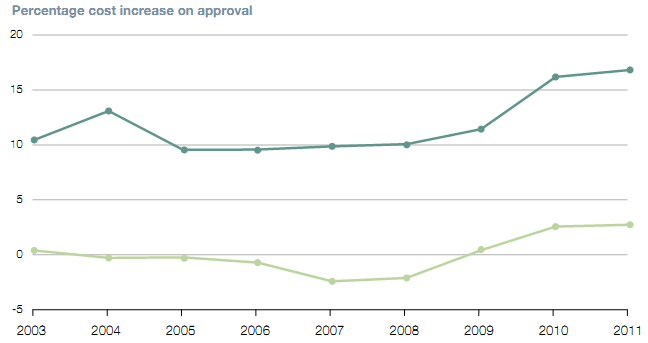
2.10 Across all projects, our analysis shows lower cost growth on projects approved over the past decade (since 2002) than those approved before this date. Figure 11 on page 24 shows the total cost increase for projects approved in or after 2002 is 2.8 per cent. However, those projects approved in or before 2001 show a bigger cost increase of 16.8 per cent.
Figure 10 |
|
NOTES 1 Chart only shows projects where numbers being purchased have changed between 2000 and 2011. 2 The unit cost of equipment is calculated by dividing the total forecast cost by the number of units to be procured. This includes all sunk and development costs of a project. However, if the Department makes real savings to a project this may still result in an increase in unit cost. Consequently, action taken by the Department to generate savings generally results in increases to unit cost. 3 The numbers of missiles being procured for Beyond Visual Range Air-to-Air Missile and for Advanced Short Range Air-to-Air Missile, as well as the number of Sting Ray torpedoes, have reduced during this period. These numbers have been excluded from the chart as they are classified. 4 Further analysis of the Nimrod maritime patrol aircraft can be found in Part Three of this Report. 5 Appendix Three shows the effect of reducing numbers on the current population of projects in the Major Projects Report 2011. Source: National Audit Office analysis of Departmental data |
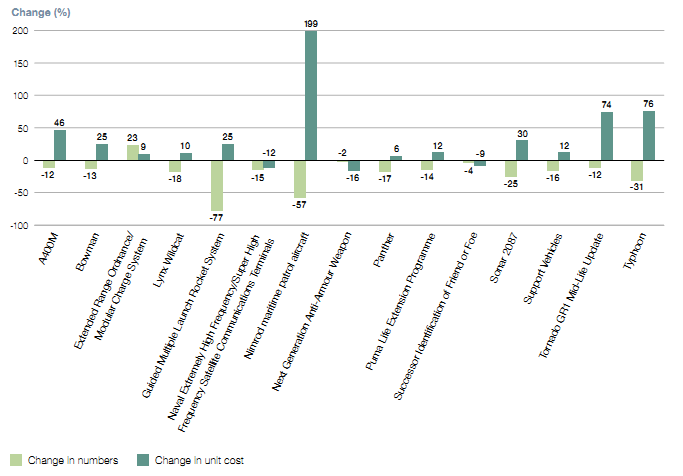
Figure 11 | |||||||||
| |||||||||
| 10.4 | 13.1 | 9.5 | 9.6 | 9.8 | 10.1 | 11.4 | 16.2 | 16.8 |
| 0.4 | -0.3 | -0.3 | -0.7 | -2.4 | -2.1 | 0.4 | 2.5 | 2.8 |
NOTES 1 The chart starts in 2003 as projects approved in 2002 do not appear in the Major Projects Report until 2003. 2 The projects have been split by the year in which they were approved, resulting in a near 50/50 split of projects. Source: National Audit Office analysis of Departmental data | |||||||||
 Projects approved in 2001 or before
 Total cost variation
2.11 The increases in 2009 and 2010, in projects approved in or after 2002, are mainly due to the £1.8 billion16 increase reported on the Queen Elizabeth Class.17 This project is the fourth largest to feature in the Report since 2000 and is covered in Figure 12. If this project is excluded from the analysis there would have been a net saving of £839 million from projects approved in or after 2002. This would have reduced the total cost increase from 2.8 per cent to a saving of 2.4 per cent against approved budgetary levels.
2.12 As older projects have had more time to accumulate cost growth, we might expect to see greater cost growth in projects that were approved in 2001 or earlier, compared with later projects. However, our analysis shows that the largest cost growth generally occurs in the early years after a project's approval. Therefore, it is reasonable to conclude that cost growth on more recently approved projects has reduced.
____________________________________________________________________________
16 £1.6 billion of this was the result of a Departmental decision in 2008 to delay spending. The remainder is a mixture of inflation and technical factors.
17 Details of this cost increase have been reported in Major Projects Report 2009 and 2010.