PFI'S PLACE IN PUBLIC EXPENDITURE
2.7 The Government only uses PFI where it is appropriate, and where it will deliver value for money. Not all investment will be suitable for PFI. This is why PFI accounts for a limited proportion of the Government's capital spending, as illustrated in Chart 2.2. The majority - over 85 per cent - of public investment is still carried out through conventional forms of procurement.
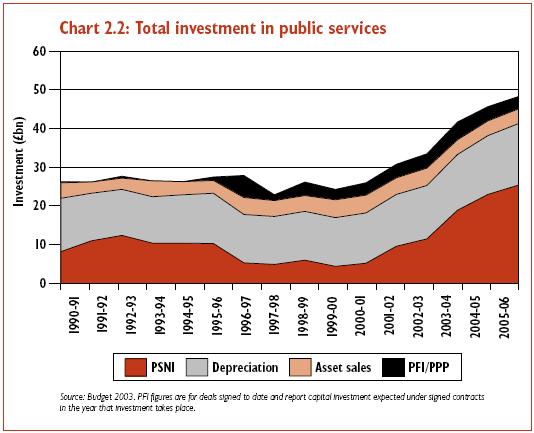
2.8 Total investment in public services will rise to over £48 billion in 2005-06, compared with £23 billion in 1997-98, a 7 per cent average annual increase after inflation. Total UK investment in public services includes: Public Sector Net Investment, reflecting conventional capital spending undertaken within departmental budgets; recycled proceeds from asset sales which are re-invested in capital on top of the budgets already available to departments; depreciation, to reflect the ongoing capital investment in existing assets to repair buildings and carry out maintenance; and investment carried out by the private sector on public service assets under PFI (including maintenance).
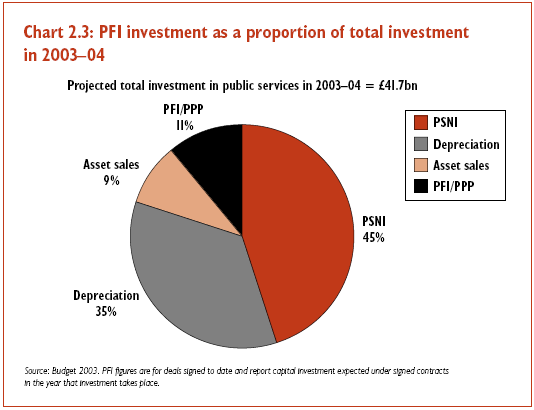
2.9 The vast majority of this increased investment is conventionally procured public investment, with the proportion of government investment represented by estimated private sector investment in public services through PFI remaining relatively constant between 1998-99 and 2003-04, at between 10 and 13.5 per cent of total investment. PFI is expected to account for an estimated £4.6 billion this year, or 11 per cent of total investment, as shown in Chart 2.3.
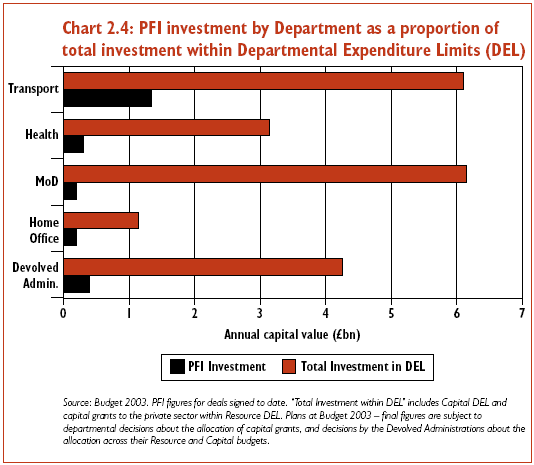
2.10 PFI remains a limited proportion of government investment within any particular sector. Chart 2.4 shows PFI investment compared with total capital investment undertaken within departmental budgets for key spending departments (excluding investment funded by asset sales), and for the devolved administrations. In no case does PFI represent more than around a quarter of investment being undertaken in a sector.
2.11 The same is true for investment undertaken through local government. Investment through PFI in local government is expected to be £1.9 billion in 2003-04, compared with capital spending on local government supported through departmental capital budgets expected at £10 billion. PFI investment in schools, which is undertaken by local education authorities, is included in this local government figure.
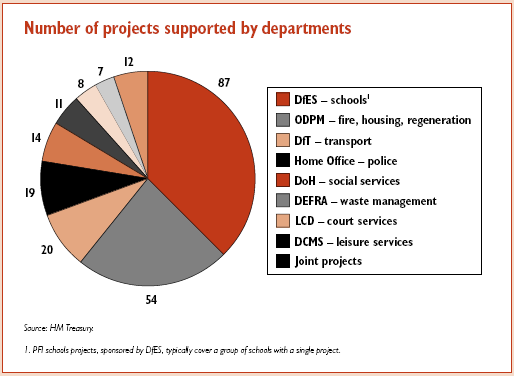
Box 2.1: PFI in local authorities Much of the PFI programme is delivered by local authorities, largely with revenue support provided by sponsoring departments. So far, 119 local authority projects have been signed, 97 of which are now operational, and a further 119 schemes are in various stages of procurement. The chart below, which shows all the local authority PFI projects, signed and unsigned, by sector, illustrates how PFI is helping authorities meet local priorities.
|