The Department's plans to reduce costs
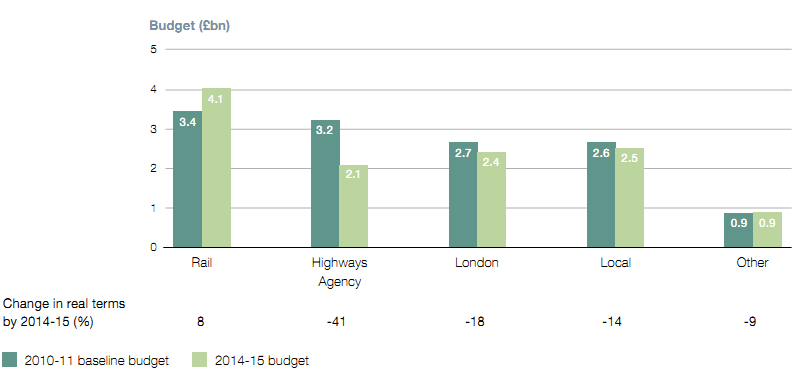
1.7 The impact of the budget reductions varies across the Department's major programme areas, but all areas of spending are affected. Figure 3 shows the change in programme area budgets over the spending review period, against the 2010-11 baseline. We also examined changes to planned spend for a sample of budget lines (see Appendix Two):
• While Figure 3 shows that total rail budgets will increase by 8 per cent in real terms by 2014-15, this is largely due to the increased spending on Crossrail and High Speed Rail. Reductions were identified from this area of spend including a 6 per cent reduction on Crossrail compared with previous spending plans, and a 10 per cent reduction in payments to Network Rail and Train Operating Companies.
• Spending through the Highways Agency will see the greatest reduction over the period, with budgets falling, in cash terms, from £3.2 billion in 2010-11 to £2.1 billion in 2014-15, a 41 per cent real-terms reduction. Appendix Two confirms that these changes require large reductions to aggregate spending plans for 2010-11 to 2014-15, including a 63 per cent reduction to previous spending plans for national road building (where original plans were for continued high levels of spending) and a 19 per cent reduction to planned road maintenance.
• Local authority spending lines will be reduced by 14 per cent in real terms by 2014-15. This reduction includes significant cuts in local highways maintenance and major schemes budgets.
• Grants to Transport for London will fall by 18 per cent in real terms by 2014-15. Total budgets across the spending review period are 14 per cent lower than previously envisaged for the same period in the 10-year funding agreement between the Department and Transport for London.
• The majority of the Department's administration budget falls under the other category. The Department agreed to reduce its £295 million administration budgets by 33 per cent by 2014-15 (real terms). It chose to restructure quickly, the accounts show staff numbers reduced by 502 in the year to April 2011.
____________________________________________________________________________________________
Figure 3 The Department's budgets at the beginning and end of the spending review period
NOTE
1 Bars are in cash terms.
Source: National Audit Office analysis of departmental spending data
____________________________________________________________________________________________
1.8 While there is an overall reduction in budgets across the spending review period, there are also significant fluctuations between individual years (Figure 4 overleaf). Three large items account for an overall rise in budgets in the first two years: spending on Crossrail, High Speed 2 development costs and a change in the treatment of ongoing costs related to the 2007 failure of Metronet (included in 'other'). The Department's budgets in the 'other' category also increase due to a £465 million contribution to the government-wide Regional Growth Fund. The Highways Agency and local authority budgets both rise slightly at the end of the period, reflecting increased spending on new major schemes.
____________________________________________________________________________________________
Figure 4 The Department's budget by major programme areas 2010-11 to 2014-15 (cash terms)

Source: National Audit Office analysis of departmental spending data
____________________________________________________________________________________________