Optimism Bias:
Underestimating the costs associated with project risks is common and is referred to as "optimism bias." In statistical terms, project planners tend to value risks according to their "Most Likely" probability of occurrence, ignoring extreme cases where the incidence of a seemingly remote risk has had a significant impact on a project. For example, if project budgets expanded by exactly 1% over the life of the project eight times out of ten, it would not be unusual to learn that those planning a similar project would budget for only that additional 1%. If the remaining two in every ten projects experienced budget overruns of an extreme 10%, however, the planning and budgeting for a project should take this into consideration (i.e., should recognize that a 1% contingency for budget overruns will not always be sufficient). If the project managers are optimistic and expand the budget by only 1%, two out of every ten projects will experience overruns on average. One should, in fact, expect an average cost expansion of 2.8% (the average of eight projects at 1% and two projects at 10%). IO avoids optimism bias by presenting all risks at their true statistical mean, which takes into account not just the "Most Likely" risk outcome, but also all possible risk outcomes.
The concept of optimism bias can be further illustrated with our example of Design Coordination and Completeness risk. Assume that this was the only risk that appeared in the risk matrix. While we defined the "Most Likely" impact under the Traditional model at 3.0%, the average or mean for this risk is actually 4.3%, owing to the skewed nature of the distribution10. This is shown in the chart below.
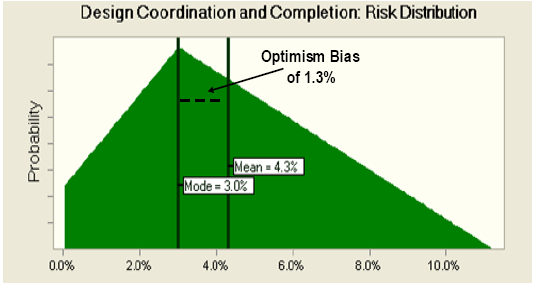
If one were to budget only 3.0% for this risk, one would underestimate the mean (or average) risk impact by 1.3% (= 4.3% - 3.0%).
Continuing with our earlier example of Design Coordination and Completion risk, for a project with estimated base costs of $60.0 million, we can calculate the cost estimates for this risk at the mean of the risk impact range.
| Calculating the Average (or Mean) Cost of a Risk Design Coordination and Completion Risk: Mean Impact (Traditional): 4.3% Cost for Risk = Estimated Mean (Traditional): Under AFP, this risk is not retained by the public sector so the impact to the public sector is $0 million. This example illustrates a cost savings under AFP for this risk of $2.32 million. |
The above example works only because of the assumption that a single risk existed on the project. It was used only to illustrate optimism bias. Since a plethora of risks occur in concert on projects, it is necessary to use a statistical simulation method to establish the true mean impact of the combined risks.
_______________________________________________________
10 Commercial Statistical programs are readily available that allow a user to select an appropriate impact range distribution (for example a triangular distribution as shown in the example) to calibrate to the 10th, Typical and 90th percentile impacts as established in the risk workshops in order to generate the Mean of the defined distribution.