4.3 Consolidated Results
Consolidated plots combining time and cost performance were prepared, refer Figures 3 and 4. However, these plots are limited in that the number of projects with complete sets of both time and cost data has limited the richness of the graphs. In addition, statistical interpretation of these graphs through the use of linear regressions can be confusing, refer Figure 4. It is considered that the most appropriate form of presentation of the results is through the use of box plots based on the percentile outcomes for the study, a box plot containing cost results for the study is provided as Figure 5 and a similar graph for time is provided as Figure 6.
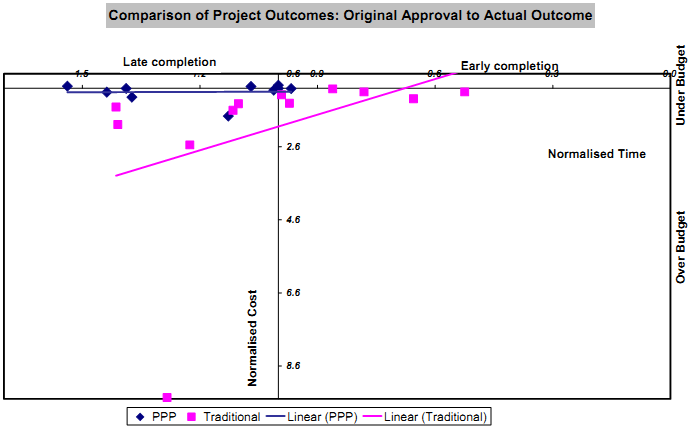
Figure 3: Full period: Normalised results: Comparison of overall results including time and cost (source: Duffield 2008)
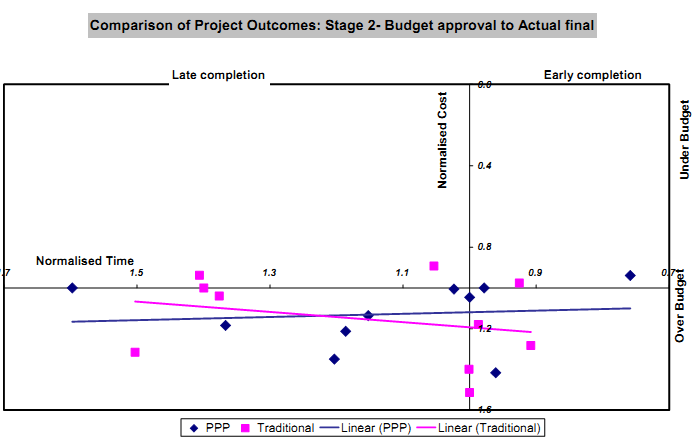
Figure 4: Stage 2: Budget to Actual Final: Normalised results: Comparison of overall results including time and cost (source: Duffield 2008)
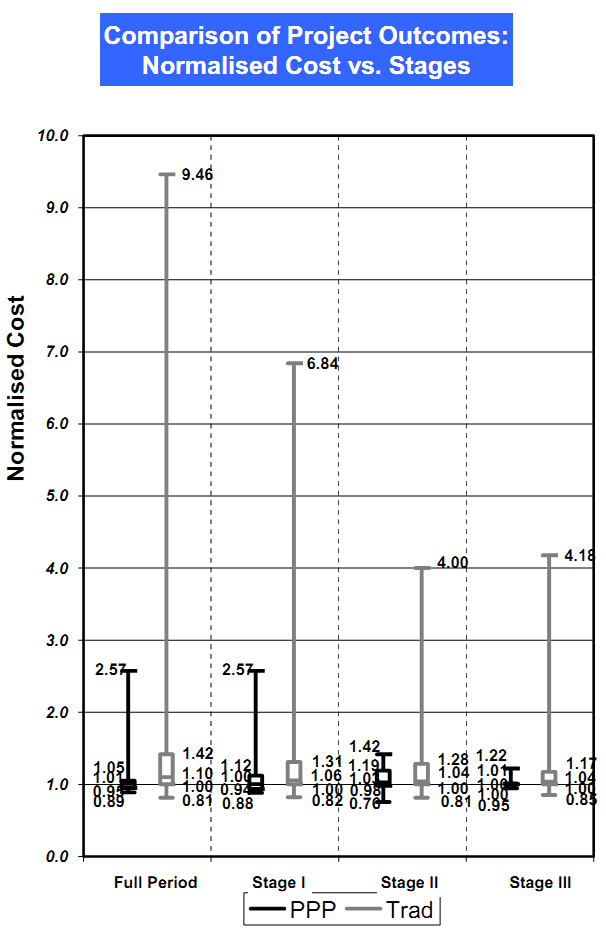
Figure 5: Normalised results based on percentile: Comparison of cost performance (source: Duffield 2008)
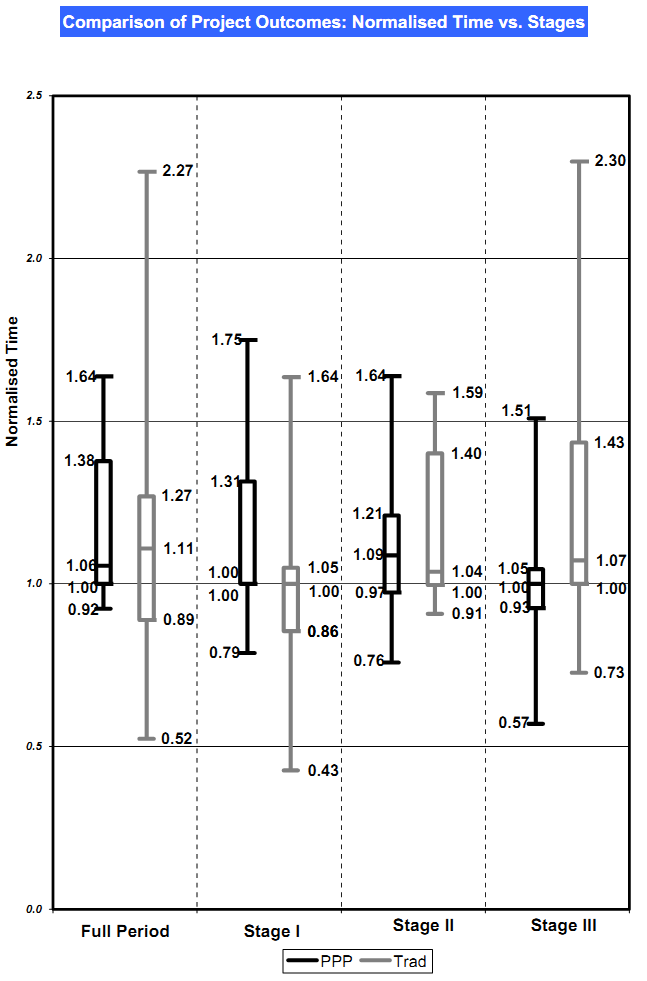
Figure 6: Normalised results based on percentile: Comparison of time performance (source: Duffield 2008)
A factor correlation was conducted for the data relating to the full period, results are presented as Table 11.
Table 11 Factor correlation of total sample, PPP projects and Traditional projects for the Full Period (source: Duffield 2008)
Factor Correlation | Procurement | Jurisdiction | Category of Infrastructure | Value of project | Duration of project | Date of Original Announcement |
Normalised Time (Full sample) | -0.03 | -0.03 | -0.12 | -0.03 | -0.12 | -0.26 |
Normalised Cost (Full sample) | 0.09 | -0.14 | -0.02 | 0.72 | -0.15 | 0.01 |
Normalised Time (PPP) | N/A | -0.05 | 0.19 | -0.48 | -0.18 | -0.39 |
Normalised Cost (PPP) | N/A | 0.57 | -0.32 | 0.22 | 0.06 | 0.35 |
Normalised Time (Traditional) | N/A | -0.02 | -0.37 | 0.04 | -0.10 | -0.19 |
Normalised Cost (Traditional) | N/A | -0.20 | 0.00 | 0.80 | -0.22 | -0.02 |
The results in Table 11 indicate the following correlations:
● The normalised cost of PPPs with the jurisdiction
● The normalised cost of PPPs with the category of infrastructure
● The normalised time of Traditional projects with the jurisdiction
● The normalised time of PPPs with the value of the project (short duration and low cost projects were adversely affected by time over-runs)
● The normalised cost of Traditional projects with the value of the project (the higher the cost of the project the worse it performed)
● PPPs commenced around 2000 had a poorer time record but more controlled costs than current projects