A1.2.2 Advanced evaluation technique
The following table details the results of the advanced probability analysis based on the same example. These are expressed as:
• Best case-representing the 5th percentile confidence limit. In other words, 5% of the simulation results for the valuation of risk improved on this outcome (i.e. were lower than this outcome) and 95% of the results exceeded this outcome (i.e. provide a greater value for risk than this outcome)
• Most likely case-representing the arithmetic mean of the simulation results. The most likely case is used to determine the net present value of the risk-adjusted public sector comparator against which the private sector bids will be evaluated.
• Worst case-representing the 95th percentile confidence limit. In other words, 95% of the simulation results for the valuation of risk improved on this outcome (i.e. were lower than this outcome) and 5% of the results exceeded this outcome (i.e. provide a greater value for risk than this outcome).
(All amounts are NPV in $ millions) | Best Case | Most Likely Case | Worst Case |
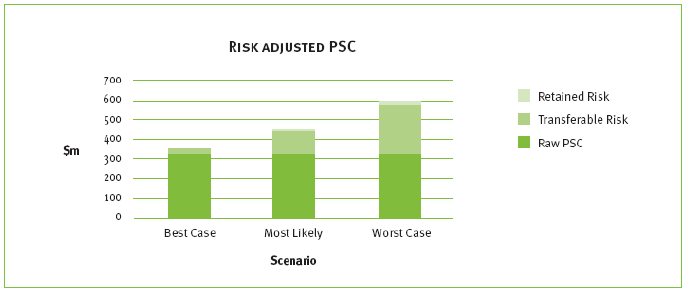
Total non-risk adjusted Project Cost (excl. GST) | 324.096 | 324.096 | 324.096 |
Retained risk | 0.460 | 10.585 | 29.629 |
Transferable risk | 25.290 | 117.479 | 246.177 |
Total risk adjusted Project Costs (excl. GST) | 349.846 | 452.160 | 599.902 |
The difference between the best case and the worst case represents the 90th percentile confidence limit within which the final outcome of the project is likely to fall. This is effectively the measure of the volatility that government is exposed to under the public sector comparator.
A bar chart can also be useful to illustrate the range of the risk-adjusted public sector comparator :