CHAPTER 1 Patterns in Global Foreign Direct Investment Stocks
Foreign direct investment has been one of the fastest-growing components of the global economy in the last two decades. In 1982, the total global stock of inward foreign direct investment was $802 billion.1 By 2002, this stock had reached $7.12 trillion, growing roughly ninefold. For perspective, global gross fixed capital formation (the sum of investments in all countries) rose from $2.3 trillion to $6.4 trillion over the same period, increasing less than threefold. Global gross domestic product (GDP) increased by approximately the same multiple.
| Types of Foreign Investment Foreign investment falls into three broad categories: loans, portfolio investment and direct investment. Loans are the exchange of funds for an obligation to repay with interest at some point in the future. Portfolio investment is the acquisition of ownership (and perhaps a dividend flow) without the acquisition of control. Loans and portfolio investment are not considered to be foreign direct investment. As equity participation grows, the influence of the individual investor also grows. Usually, it is assumed that ownership of more than 10 per cent of a company's voting shares constitutes effective control and is therefore the borderline between portfolio and direct investment. This is the definition used in most foreign direct investment statistics. However, control in these circumstances depends on a number of factors, including the distribution of the remaining shares.1 Foreign investment becomes indisputably foreign direct investment only when more than 50 per cent of voting shares are owned. At the top end are the wholly owned companies or subsidiaries where there is 100 per cent ownership by the parent. Foreign direct investment consists of "greenfield" investments (e.g., foreign capital spending on new subsidiary firms, plant and equipment), reinvestment of earnings into existing subsidiary operations (e.g., retooling or expansion of office space or plant), and mergers and acquisitions. 1 For example, a single ownership share of 10 per cent (which could be foreign ownership) has been allowed in Canadian banks for decades. The maximum allowed ownership share was recently raised to 20 per cent (provided there was ministerial approval). There is no indication that this level of ownership provides any substantial degree of control over the banks by the individual large equity holders. Source: The Conference Board of Canada. |
Contrary to popular belief, the share of global FDI stocks2 in the developing economies has not grown in the last two decades. In fact, it fell from 44 per cent in 1980 to about 28 per cent in 1990. By the 2000-02 period, it was still only about 33 per cent, that is, 11 percentage points lower than in 1980. (See Table 1.) China is an exception and saw its share of global FDI stock surge from 1.3 per cent in 1990 to a spectacular 6.3 per cent in 2002. India's share of global FDI increased from 0.1 to 0.4 per cent over the same period; it has not yet become a major player in the global investment arena. As for Central and Eastern Europe, this region experienced a substantial increase following the decline of the Soviet regime: inward foreign direct investment grew from zero in 1989 to account for a 2.6 per cent share of global FDI stocks by 2002.
Western Europe (largely made up of the European Union countries) increased its share of the global stock of inward direct investment from 33 per cent in 1980 to about 41 per cent in 1990 and was still able to maintain a 39 per cent share in the 2000-02 period. Much of this investment stemmed from the closer integration of markets under the European Union's single-market policies.
The U.S. share of the global stock of inward direct investment remained fairly stable at about 20 per cent during the last decade. However, annual flows were highly variable, reflecting changing levels of enthusiasm about the dynamism of the American economy. In 1980, the United States absorbed 18 per cent of global flows, which increased to 22 per cent in 2000. With the bursting of the high-tech bubble and the threat of terrorism, the U.S. share of global flows collapsed to 4.6 per cent in 2002. Now China outcompetes the United States, attracting 8 per cent of global annual FDI flows.
| Table 1 Distribution of World FDI Inward Stock (per cent) | ||||||
| 1980 | 1990 | 2000 | 2002 | |||
| Developed Economies | 56.0 | 71.6 | 64.9 | 64.5 | ||
| Western Europe | 33.3 | 40.7 | 38.4 | 39.0 | ||
| United States | 11.9 | 20.2 | 19.8 | 19.0 | ||
| Canada | 7.7 | 5.8 | 3.3 | 3.1 | ||
| Developing Economies | 44.0 | 28.2 | 33.0 | 32.8 | ||
| Asia & Pacific | 32.2 | 19.6 | 20.8 | 19.7 | ||
| China (mainland) | 0.9 | 1.3 | 5.7 | 6.3 | ||
| India | 0.2 | 0.1 | 0.3 | 0.4 | ||
| Central & Eastern Europe | - | 0.1 | 2.1 | 2.6 | ||
| Sources: The Conference Board of Canada; UNCTAD, World Investment Report 2003, Table B.3, pp. 257-60. | ||||||
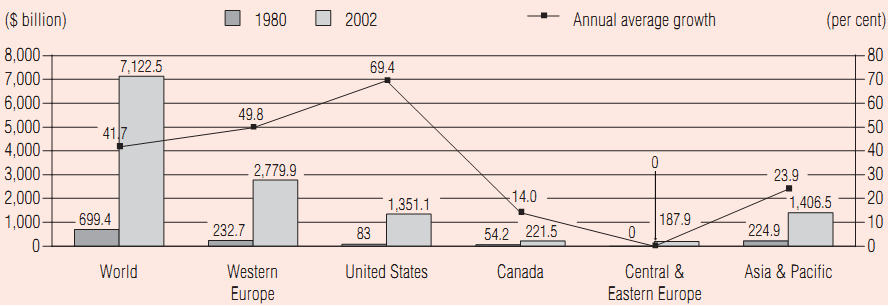
Looked at in the long term, however, the United States recorded the highest growth in its stock of inward FDI during the past two decades. Stocks expanded from $83 billion in 1980 to $1.35 trillion in 2002, for an annual average growth rate of 69 per cent. (See Chart 2.) Western Europe, as a region, also experienced an impressive annual average growth rate of 50 per cent over the same period. Canada, on the other hand, recorded an annual average growth rate of only 14 per cent. Over the last 20 years or so, Canada has clearly underperformed in attracting foreign direct investment.
| Chart 2 Inward FDI Stock and Stock Growth |
|
|
| Sources: The Conference Board of Canada; UNCTAD, World Investment Report 2003, Table B.3, pp. 257-60. |
Canada's stock of inward FDI as a percentage of GDP continues to increase (see Chart 3), but the same is true for other countries, especially Ireland, whose FDI as a percentage of GDP increased 16.3-fold from 1980 to 2002. Canada, on the other hand, recorded a mere 1.5-fold growth rate: from 20.4 per cent in 1980 to 30.0 per cent in 2002.
The decline of FDI inflow into Canada is largely (89 per cent) due to the fall in sales of existing interests in Canada to non-residents (through mergers and acquisitions).3 It is important to note, therefore, that the implications of this decline for Canada's overall economy are less than they would have been if the decline were due primarily to reduced investment in new fixed capital. Mergers and acquisitions do not initially create new wealth and jobs, but they can still provide important knowledge and technology transfers that make Canadian businesses more competitive. Nevertheless, more than 10 per cent of the decline in FDI inflow - not a negligible amount-was in new fixed capital investment.
The United States still accounts for 64 per cent of inward FDI flows into Canada, a share that has held steady for the last three years.4 It remains the most important source of foreign investment into our country.