9.5.1 Discount Rate Sensitivity
In order to evaluate the robustness of the quantitative analysis with respect to varying discount rates, Partnerships BC's guidance calls for a discount rate sensitivity analysis to examine a + / - percentage range around the discount rate determined for a project. The discount rate sensitivity also looks at the break even discount rate which is the discount rate that results in zero value for money. To carry out the analysis, all of the other inputs in both models are left unchanged and the discount rate applied to the cash flows is adjusted in 25 or 50 basis point increments13. The resulting net present costs are then compared to determine the revised value for money proposition.
The results of this analysis can be shown in two ways: as a discount rate sensitivity analysis table as in Figure 8, or in a quantitative value for money curve diagram as in Figure 9.
The table in Figure 8 shows a sample sensitivity analysis on the discount rate assumed for a project based on a range of + / - one per cent. The left column shows the base discount rate of 7.7 per cent, as well as the increments around that value that are tested. The right column shows the resulting quantitative value for money (VFM) expected from pursuing the project as a PPP for each increment contemplated.
Figure 8: Discount Rate Sensitivity Analysis
Sensitivity | VFM PV ($m) | |
Base Case | 7.7% | 65 |
+1% | 8.7% | 109 |
-1% | 6.7% | 12 |
+0.5% | 8.2% | 88 |
-0.5% | 7.2% | 40 |
Break Even | 6.5% | 0 |
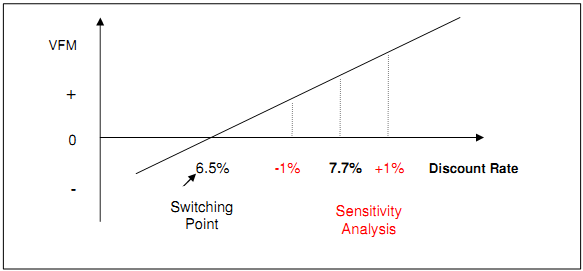
The quantitative value for money curve is an extension of the discount rate sensitivity analysis as it contemplates a range of possible discount rates, while highlighting the break even point (shown here as the switching point) between the PSC and PPP option selection. The discount rate values to the left of the switching point will produce negative quantitative value for money, consequently recommending the traditional procurement method. Values to the right of the switching point, on the other hand, will produce positive quantitative value for money, recommending the PPP option. A discount rate with the same value as the switching point would result in the same present value cost of the two alternatives and zero value for money.
Figure 9 shows an example of the quantitative value for money curve. The switching point in this example is a 6.5 per cent discount rate. The actual discount rate used in the example is 7.7 per cent.
Figure 9: Quantitative Value for Money Curve
_________________________________________________________________________________
13 One basis point is equal to 1/100th of a percentage point.