10.1.1 Probability Distribution
The Monte Carlo analysis14 produces several outputs.
Figure 12 below shows the probability distribution for the expected value of all quantified project risks. The resulting distribution is normal, as evidenced by the shape of the curve, with the area in blue representing the expected values within the 90 per cent confidence interval. In the case of this example, the confidence interval states that there is a 90 per cent probability that the value of the risks is between $57 million and $137 million. The mean is $97 million. The areas in red at both ends of the curve represent the area outside the confidence interval. In this case each red area represents five per cent of all expected values.
Figure 12: Probability Distribution of Total Risk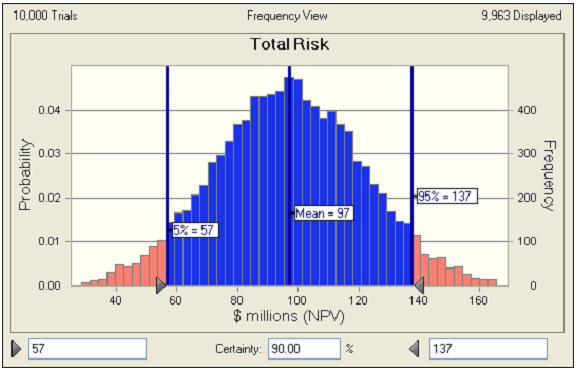
As detailed in Section 4.2, the risks identified in the distribution are either: transferred to the private partner, retained by government, or shared.
__________________________________________________________________________________
14 Monte Carlo analysis is an analytical technique in which a large number of simulations are run using random quantities for uncertain variables and looking at the distribution of results to infer which values are most likely. More details on this approach are discussed in Appendix 2: Risk Modelling Methodologies.