10.1.2 Frequency Distribution
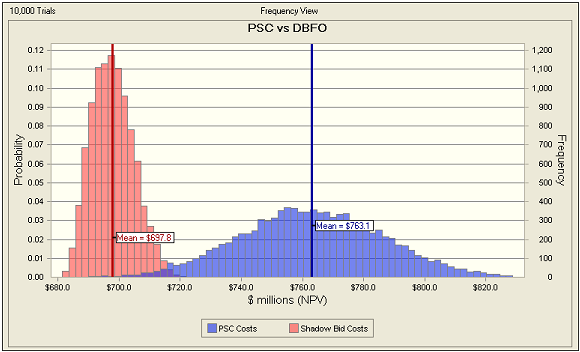
Figure 13 below provides a comparison of the probability distributions for the expected value of all costs under the PSC compared to those under the Shadow Bid (in this case a DBFO).
The distributions capture the following costs:
• Base capital costs, including a range of potential efficiencies;
• Operations, maintenance and rehabilitation (OMR) base costs;
• Transferred risks (capital and OMR);
• Retained costs; and
• Quantified retained risks.
The resulting distributions are normal, as evidenced by the shape of the curves. Overlaying the DBFO and PSC distributions in this way demonstrates that the range of DBFO costs has a tighter distribution than the PSC costs, and that the mean of the DBFO distribution is $65 million less than the PSC. This is the value for money expected from procuring this project as a DBFO.
Figure 13: Comparing Frequency Distributions of Risk-Adjusted Cost: PSC and DBFO