10.5 Annual Service Payment Chart
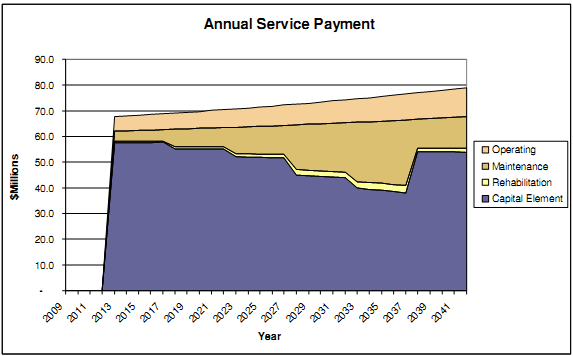
The chart in Figure 17 presents a visual breakdown of the ASP over time into capital, life cycle (maintenance and rehabilitation) and operations categories.
Figure 17: Annual Service Payment Breakdown Chart
The chart in Figure 17 presents a visual breakdown of the ASP over time into capital, life cycle (maintenance and rehabilitation) and operations categories.
Figure 17: Annual Service Payment Breakdown Chart