Appendix 4: Discounted Cash Flow Analysis
Cash flow streams under PSC and Shadow Bid models will generally have different time profiles19 due to differing underlying construction schedules. This can result in different start dates and different completion dates. If the time profiles were the same, the cash flow streams would match in terms of timing of incurrence and could be directly compared to each other on a periodic (usually annual) basis; however, the substantial differences in cash flow timing make an overlay cost comparison impractical and sometimes impossible.
To be able to compare the procurement models, the cash flow streams are discounted to a common start date. This is typically present-day but it can be any point in time. The process of valuing an investment by discounting its cash flows is known as discounted cash flow analysis. The final output of discounted cash flow analysis is the net present value (NPV) or frequently, in PPP projects, the net present cost (NPC)-the difference being that NPV includes both revenue and cost streams whereas NPC includes only cost components.
The NPV or NPC is calculated using the same formula, shown below:
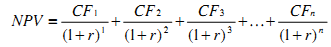
Where:
CFn = Cash flow in period n
r = Discount rate
n = Number of periods
As shown in the formula, the two key components required to calculate discounted cash flows are the cash flow estimates and a discount rate. First, future cash flows over the term of a project are estimated by members of the project team. Then, a discount rate is applied to these cash flows to discount them to a common date.
To show how discounted cash flow analysis is performed, consider the following simplified example:
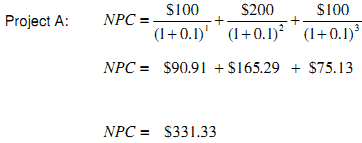
Assume a firm is considering two projects: Project A and Project B. Project A requires $100 at the end of year one, $200 at the end of year two, and $100 at the end of year three.
Project B requires the firm to pay $400 at the end of year three. Both projects require a $400 cash outlay so which project has the lowest cost? Assuming the discount rate is 10 per cent and using the discounted cash flow formula, here is the summary of the NPC for both projects:
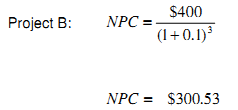
This example demonstrates that even though at the first glance it appears that the costs for both projects are the same, comparing their cash flows by discounting them to a common date reveals that Project B costs less than Project A. Based on this analysis, the firm should pursue Project B.
__________________________________________________________________________________
19 Refer to Appendix 6: Financial Model, for more details.